Unsettled weather last week featured a good deal of showery convective storms over different parts of the Mole catchment each day. How these rainfall events contributed to discharge downstream highlights many of the unusual characteristics of the Mole catchment and how it deals with inputs of precipitation.

(note different scale on vertical axes)
Here’s a diagram to remind us of some of the key flows that will be mentioned in this post.

In this post, I start by looking at how storms last week translated into flood peaks downstream. I show how the Upper Mole basin dominates total catchment discharge compared to the the contribution from the Lower Mole. This is the case, interestingly, in all but extremely high or low flow conditions. We then explore some of the hydrological characteristics of the Mole catchment and how these influence flows. Finally, I highlight some of the uncertainties hampering a complete audit of flows in the catchment.
Each day last week brought a different configuration of showers with widely different amounts of rainfall in different places. These are ideal for showing the relative contribution each part of the drainage basin makes to peaks in discharge as they travel downstream.

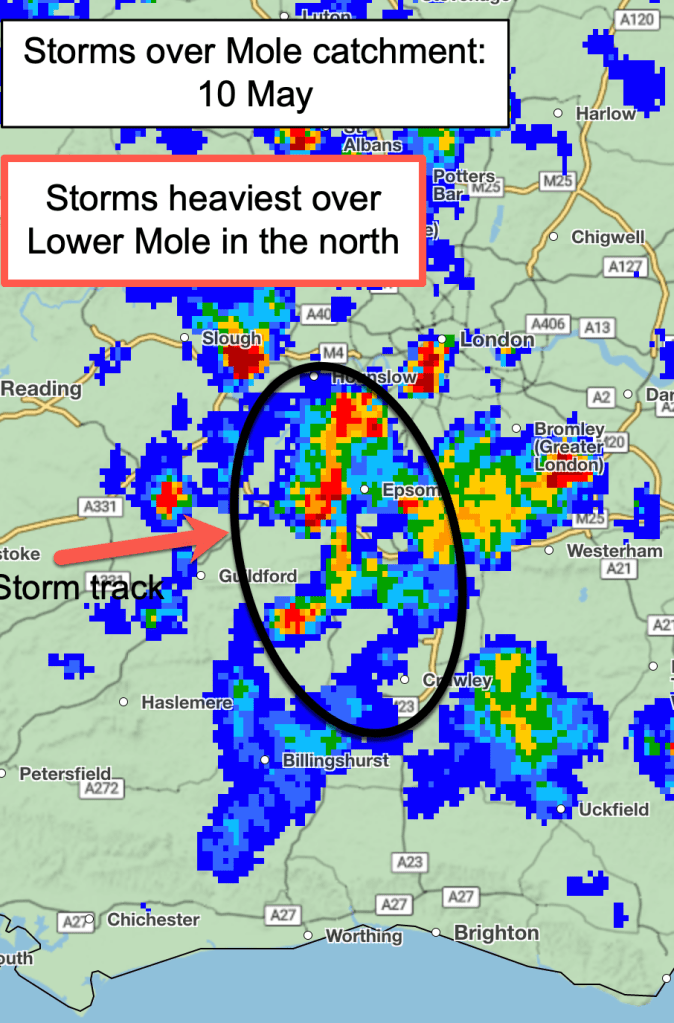

In particular, both the 9 May and 11 May saw storms mainly dropping rain over the south of the catchment, the Upper Mole, while 10 May saw most heavy rain fall further north over the Lower Mole part of the catchment. The changing configuration of these showers turned out to be useful in showing how the whole catchment responds to rainfall and which part most controls discharge.

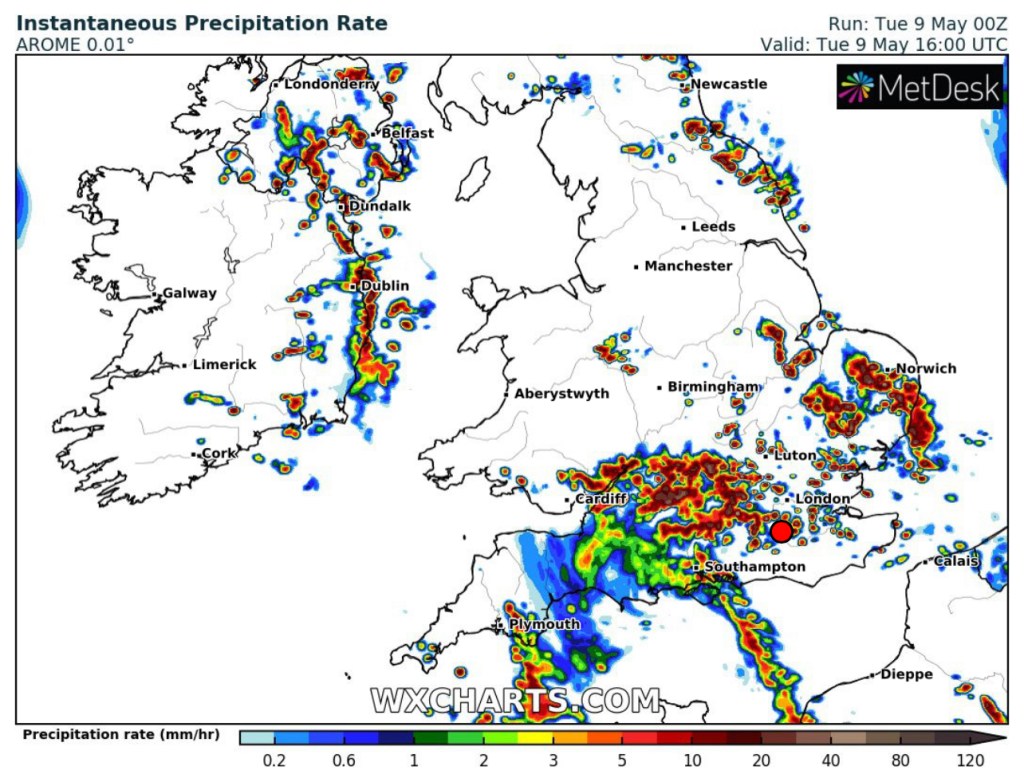
As is usual for convective stormy episodes forecast models struggled to pin down how much rain would fall even up to the day before. Predictions of total rain accumulation for 9 May ranged from 0.4mm to over 19.8mm. It turned out the upper end proved to be an underestimate for anywhere caught under the thunderstorm on 9 May.
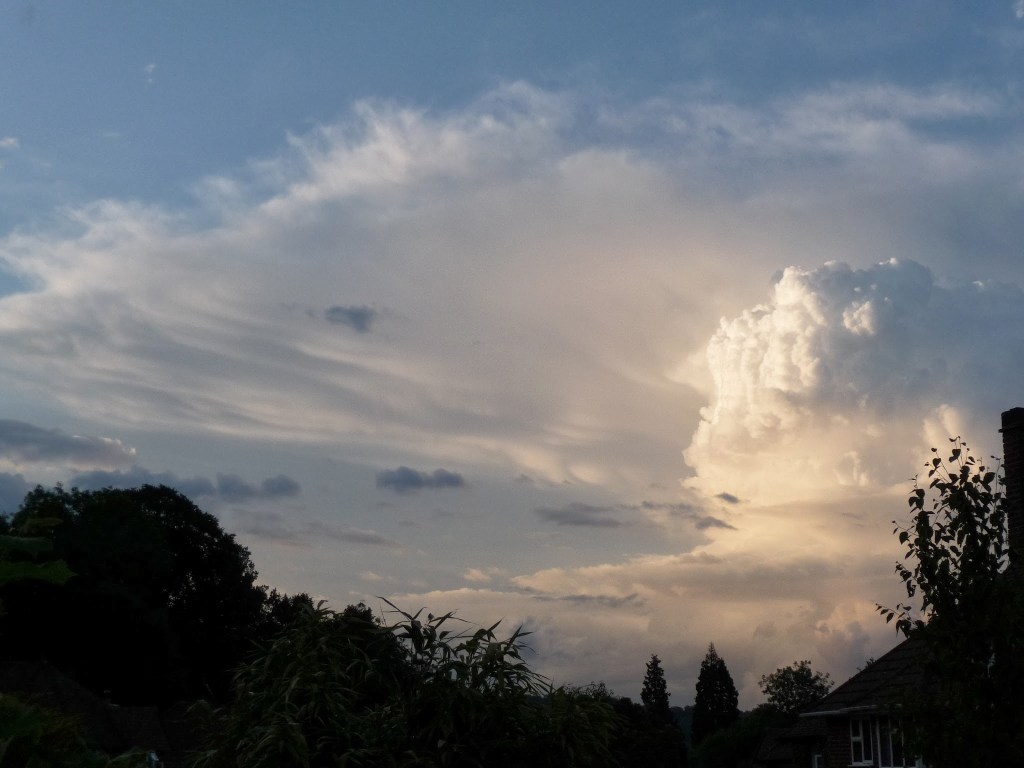
The chart below shows rainfall for the whole week for Charlwood (near Gatwick and Crawley in the Upper Mole). Each day featured convective activity with clouds bubbling up to a greater or lesser extent. Like many places in the Upper Mole, Charlwood had most most rain on 9 and 11 May with nothing much at all on 10 May.

Here comes the rain: where and how much?
Let’s look at the distribution and total rainfall for 8-11 May and associate the rainfall with river discharge for stations downstream.
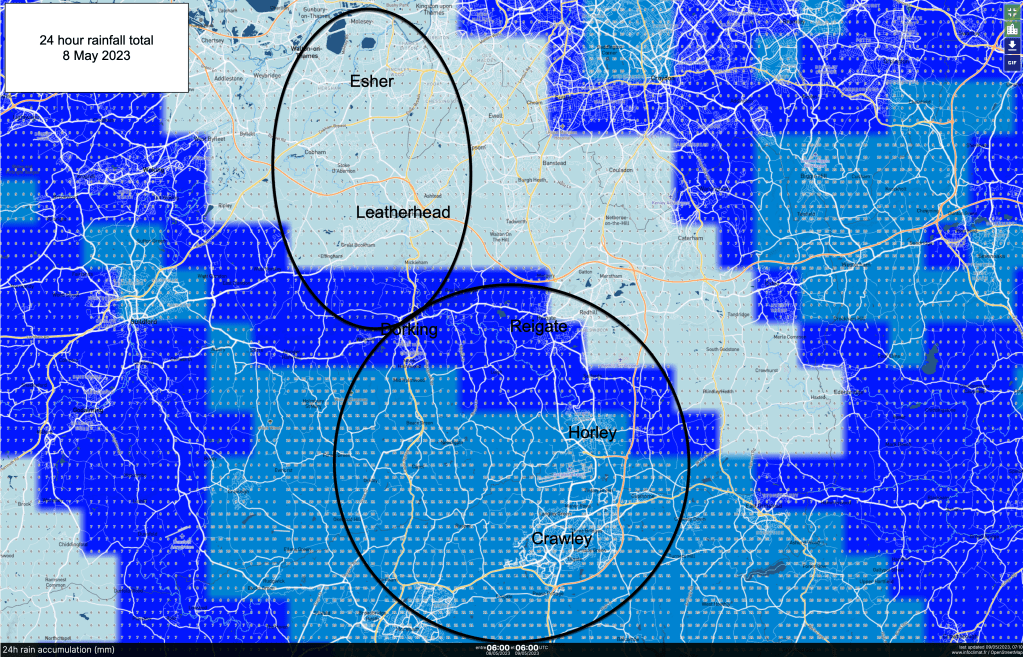
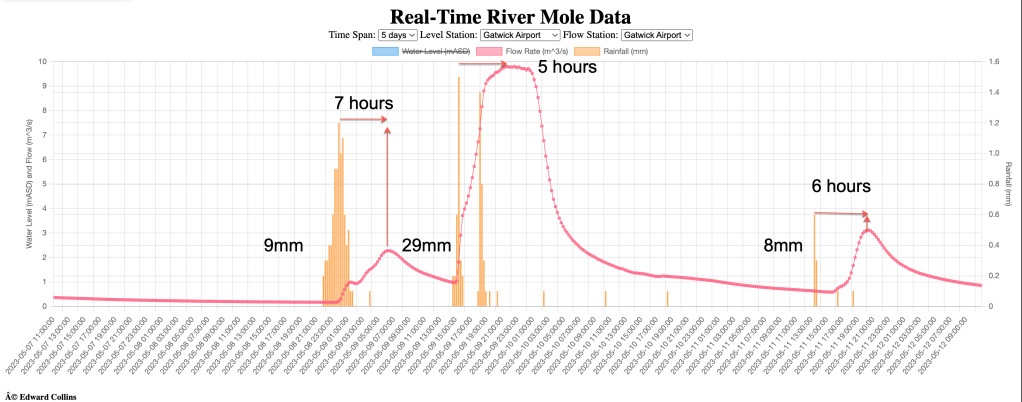
The evening of 8 May saw rainfall up to 10mm widely across the Upper Mole. Peak rainfall intensity occurred around midnight and the river at Gatwick responded rising to reach a peak discharge of 2m³/s at 06:15 on 9 May, a 7 hour lag time. This peak proceeded downstream and registered at Dorking 8 hours later. By that time, however, large thunderstorms were building up further upstream.
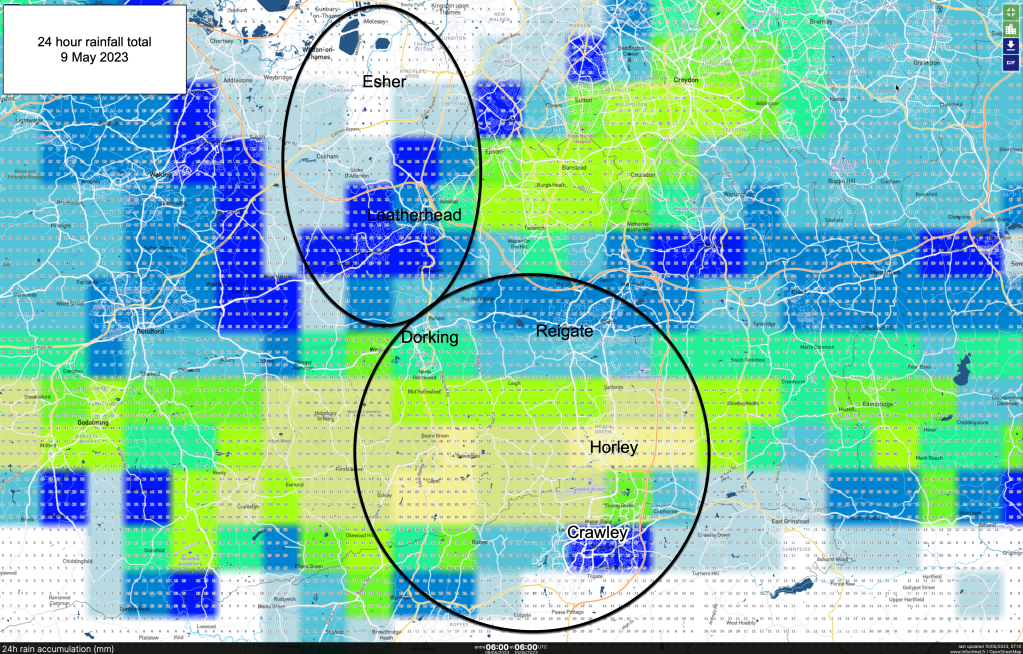
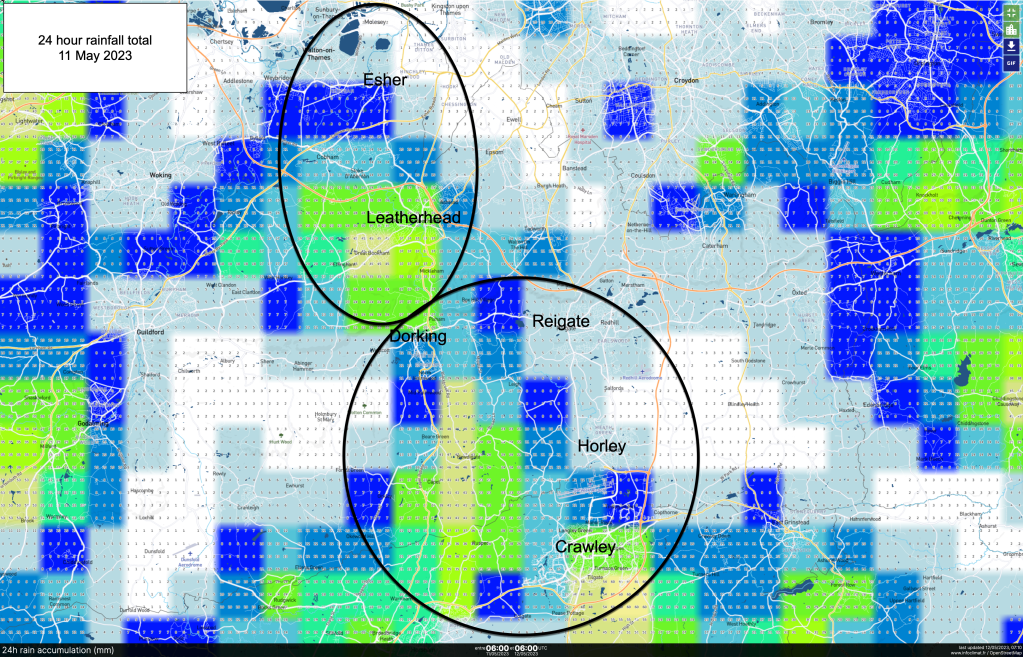
The afternoon of 9 May saw much heavier rain in bands of thunderstorms slowly crossing the Upper Mole catchment. The radar interpretation of daily rainfall total above shows brighter colours as more rain. These charts tend to exaggerate heavy rain totals so treat the higher end figures with caution. However, the broad pattern gives a reasonable picture of large scale events but radar and AWS (automatic weather stations) on the ground plus reports from people give a more accurate picture of what happened where.

For example, data from AWS in the map above show highest totals were somewhat further south than the daily total maps suggest, the largest totals being over Crawley and to the west over Rusper. This supports observations and social media reports from people on the ground and radar observations from the day shown below.
The unusually heavy downpour that occurred from this slow moving thunderstorm dropped up to 30mm of rain over the course the afternoon. A 4-hour rainfall of 30 mm has a return period of 3.67 years. For some places in Crawley half of this (15mm) fell in 1 hour between 3 and 4pm. This intensity has a return period of about 6-7 years. Meaning a storm of this nature would only be expected every 6 years or so.

One automatic weather station in Rusper recorded a huge 63mm of rain. This was the only AWS to record such a high rainfall figure locally so must be treated with caution. However, a cursory look across the records for this station at other times suggest it returns reasonable records matched to others so it cannot be ignored entirely. Indeed, the main event returned a quite feasible 40mm of rain with a 20mm “top up” from another shower later on to bring it to over 60mm. The rainfall total of 60mm for a day or 30mm recorded in 1 hour both equate to a return period of around 30 years, so a significant rainfall intensity.
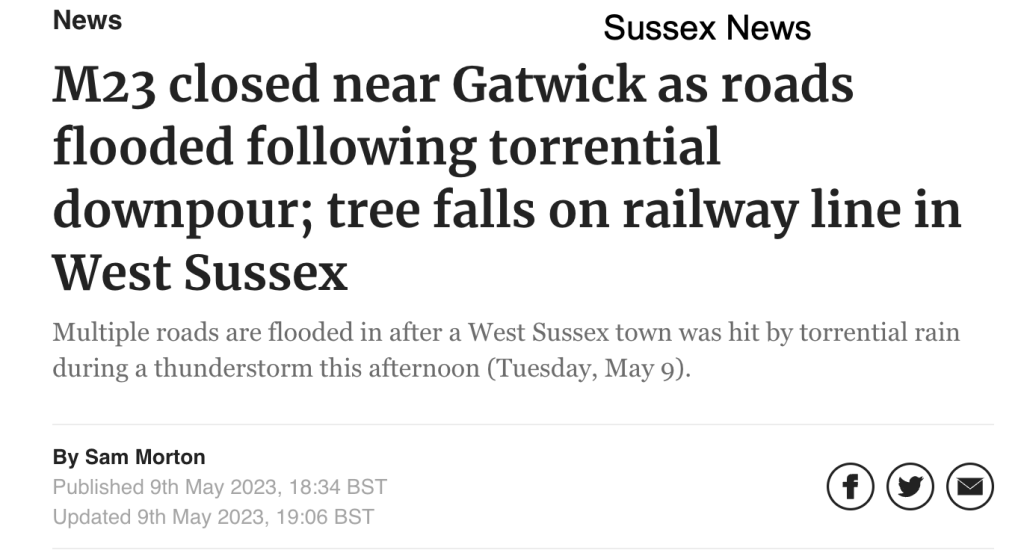
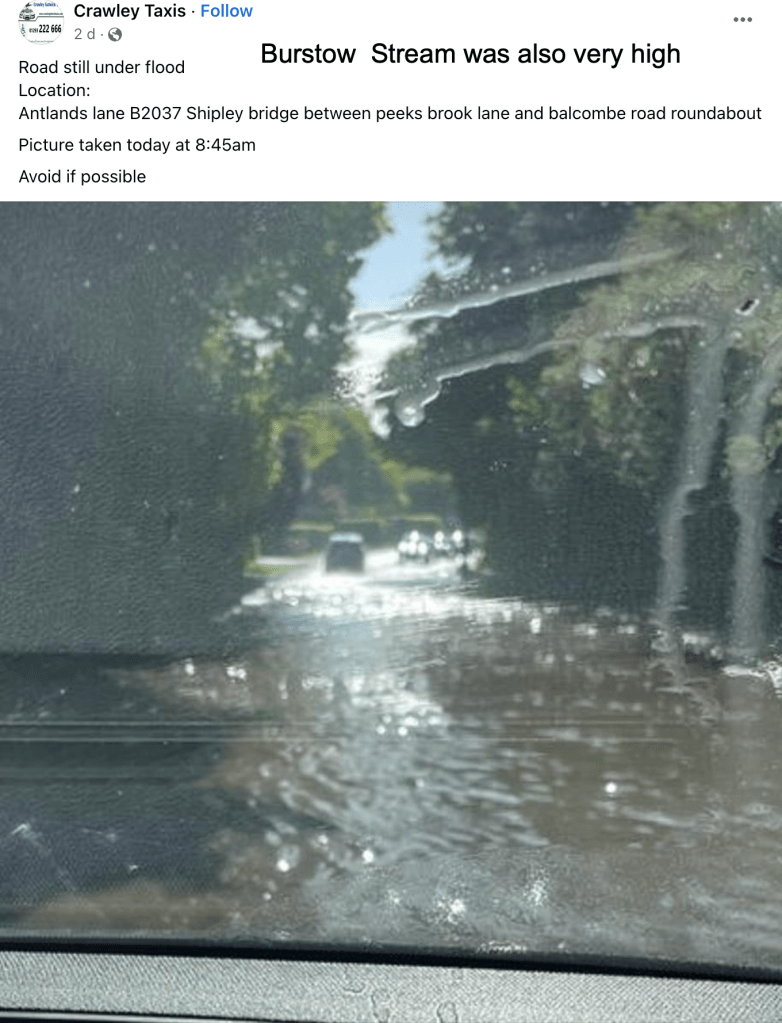
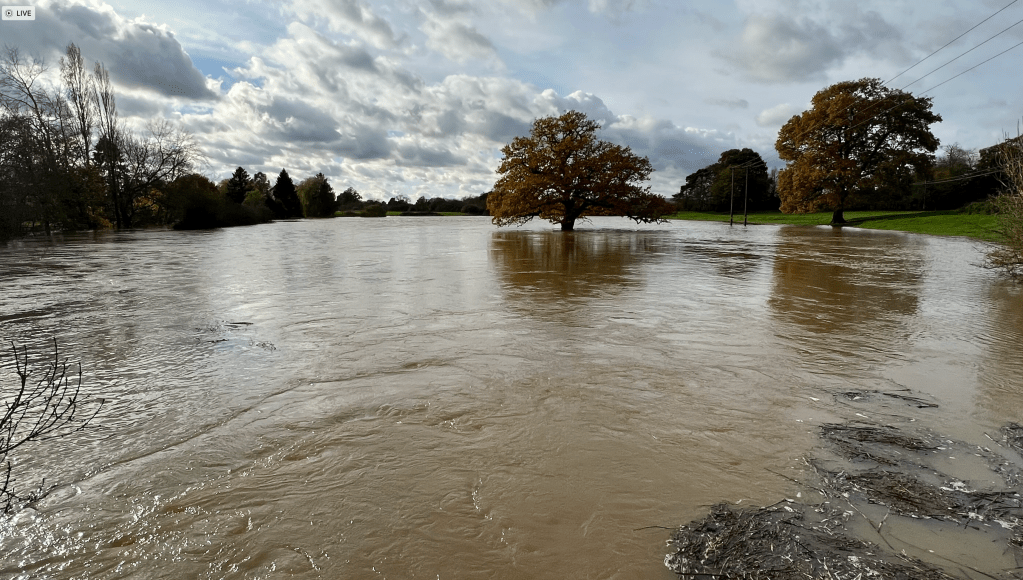
Regardless of the accuracy of the Rusper record, the widespread heavy rain across Crawley caused the Upper Mole and surrounding tributaries to rise quickly and cause local flooding. Social media posts showed floods widely across a broad swathe of the town, especially in Ifield and Pound Hill as well as on the Burstow Stream at Shipley Bridge and near Rusper.


Peak rainfall intensity was around 3:00pm on 9 May and the Mole rose very quickly to reach a peak discharge at Gatwick of 9.8m³/s in 5 hours. To put this into perspective the very wet days of 15-16 November 2022 saw 56mm of rain fall over two days and on that occasion discharge at Gatwick rose to just below 11m³/s.
So the 9 May river discharge was not far off the November floods despite considerably less total rainfall. I’ve argued this before but this shows again that it is the intensity of rain and the duration over which it falls, more than the total, which seems to be the important determining factor in discharge response of the Upper Mole catchment. How intense the rainfall is makes the biggest difference to river levels.
The 10 May was a quieter day with most rain falling over the north of the catchment in the Lower Mole. Places in the Upper Mole saw almost no rain at all. At Gatwick the hydrograph shows levels descending all day.
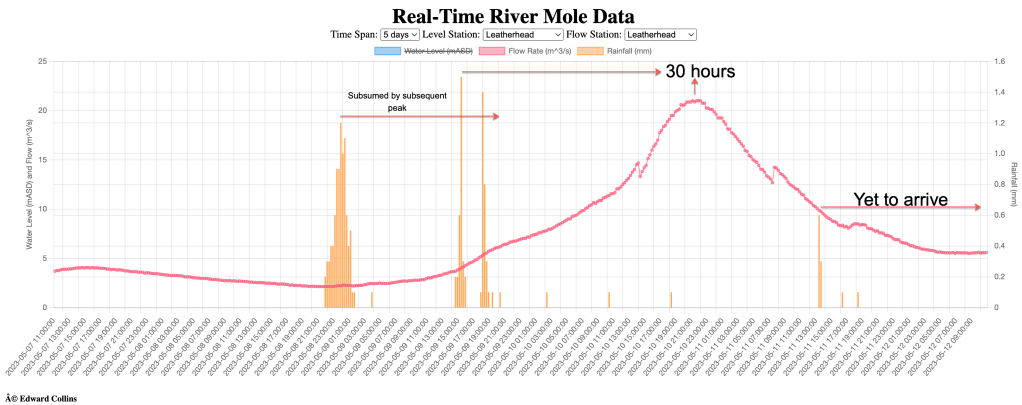
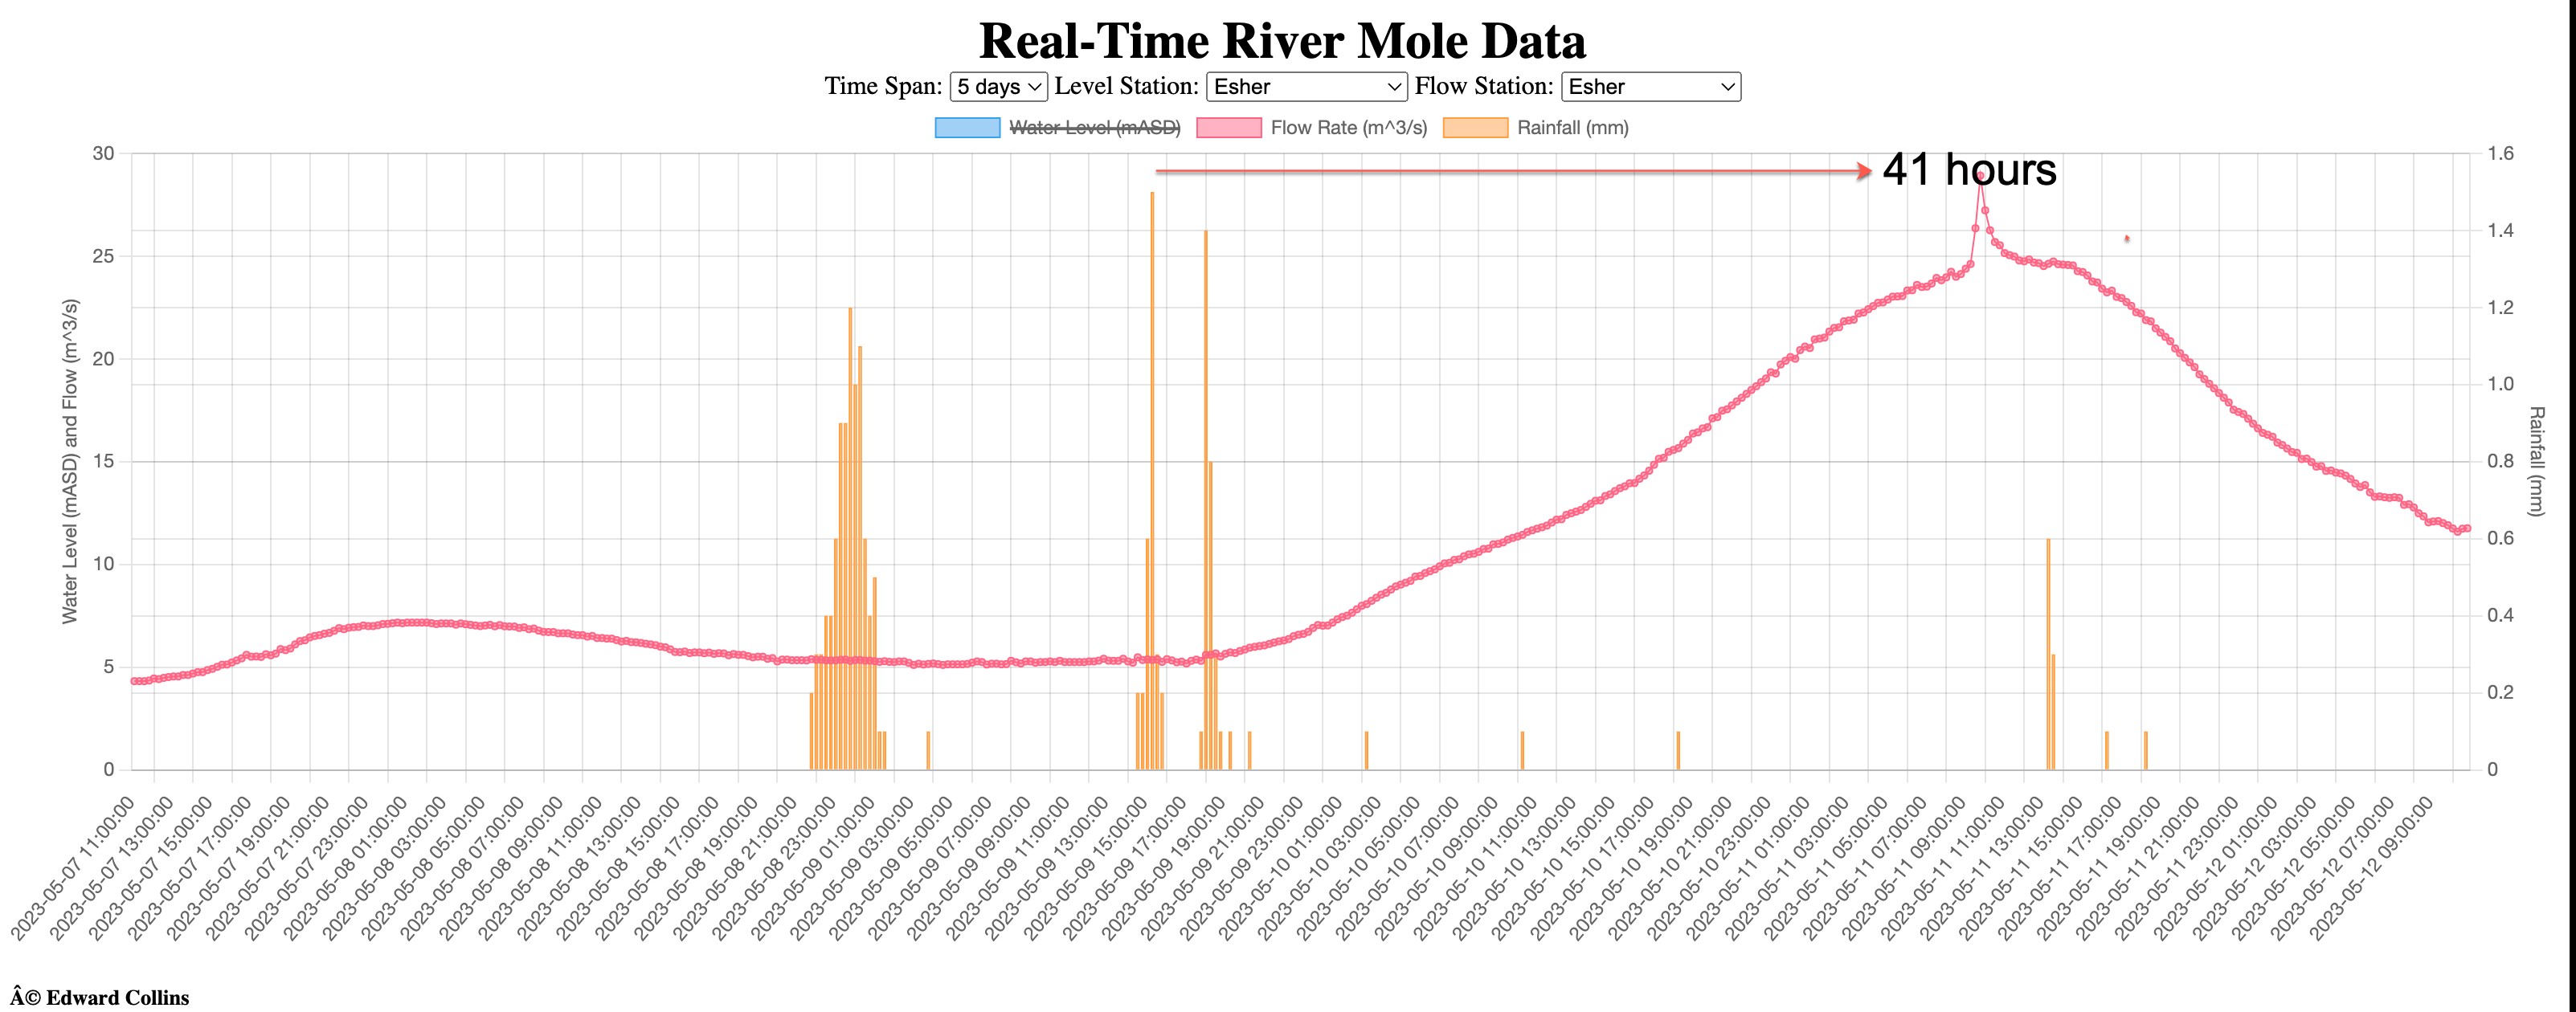
In contrast, Leatherhead and Esher gauges both show levels rising throughout the 10 May, showing the peak discharge from the Crawley thunderstorm on 9 May arriving at those locations, having collected additional discharge from every tributary in the Upper Mole. Leatherhead peaked in the evening of 10 May at over 20m³/s. This figures is double the discharge of the Mole at Gatwick which makes sense because the Gatwick Stream joins the Mole downstream of this gauge and doubles the discharge.

Throughout 10 May the showers in the Lower Mole, due to the nature of catchment, made little discernible impression on the hydrograph at Leatherhead or Esher.
This is partly because the huge rising limb from the 9 May storms in the Upper Mole was arriving in the Lower Mole through the day on 10 May. Due to the nature of the Mole catchment, rainfall over the Lower Mole area has less impact on the river than what goes on in the Upper Mole. I’ll explain why below.
The hydrographs for Leatherhead and Esher demonstrate the critical importance of rainfall in the Upper Mole to the discharge of the River Mole. Rainfall on both the 8 and 9 May mostly occurred in the Upper Mole and delivered significant peak discharge to the Lower Mole 24-48 hours later. They show the 8 May peak discharge, obvious on the Gatwick chart, no longer visible as it is subsumed by the rising limb of the arrival of the bigger 9 May storm peak. The 8 May peak wasn’t so much overtaken by the peak of 9 May but rather was “submerged” by the earliest rising waters resulting from the earliest 9 May rain. (The odd blip on Esher discharge shows the impact of sluice operation, the first of which is just upstream of the Esher gauge).

Finally, 11 May saw widespread showers across the whole catchment but not on the same intensity as 9 May. This time rainfall occurred in both the Upper and Lower Mole.
The relatively heavy showers on 11 May registered as a rise at Gatwick to 3m³/s but with only a very slight impact on gauges further downstream.

For example, in the chart above, the slight rise indicated at Esher around 40 hours after the rain occurred in the Upper Mole shows how the Lower Mole is essentially the recipient of discharge from upstream, homegrown discharge from the Lower Mole is less significant in the total volumes represented in most normal conditions.
I’ll now go on to explain why the Upper Mole dominates the behaviour of the River Mole!
The Lower Mole is essentially the recipient of discharge from upstream and the bulk of discharge flowing into the Thames has its origins in the Upper Mole basin. This might seem obvious, and to some extent it is, but the very high proportion of upstream discharge as a proportion of the total flow of the Mole joining the Thames is, I think, probably quite unusual for river behaviour and at least worth discussion. Let me know if you know other rivers which behave like this… where the upper catchment dominates flow and the lower catchment behaves more like a canal.

To explain how the River Mole responds to rainfall across the catchment it is important to remember that the Mole catchment is a strange shape with an odd pattern of relief, distinctive stream network with important geology characteristics and varied land use that all combine to determine how water is collected and transferred downstream. It’s known to be a flashy river which means it rises and falls quickly due to rain. These characteristics will become especially important when considering how our catchment responds to the increasingly intense rainfall predicted with climate change. Let’s briefly look at how each characteristic impacts river response so that we can understand the importance of the Upper Mole to total discharge.
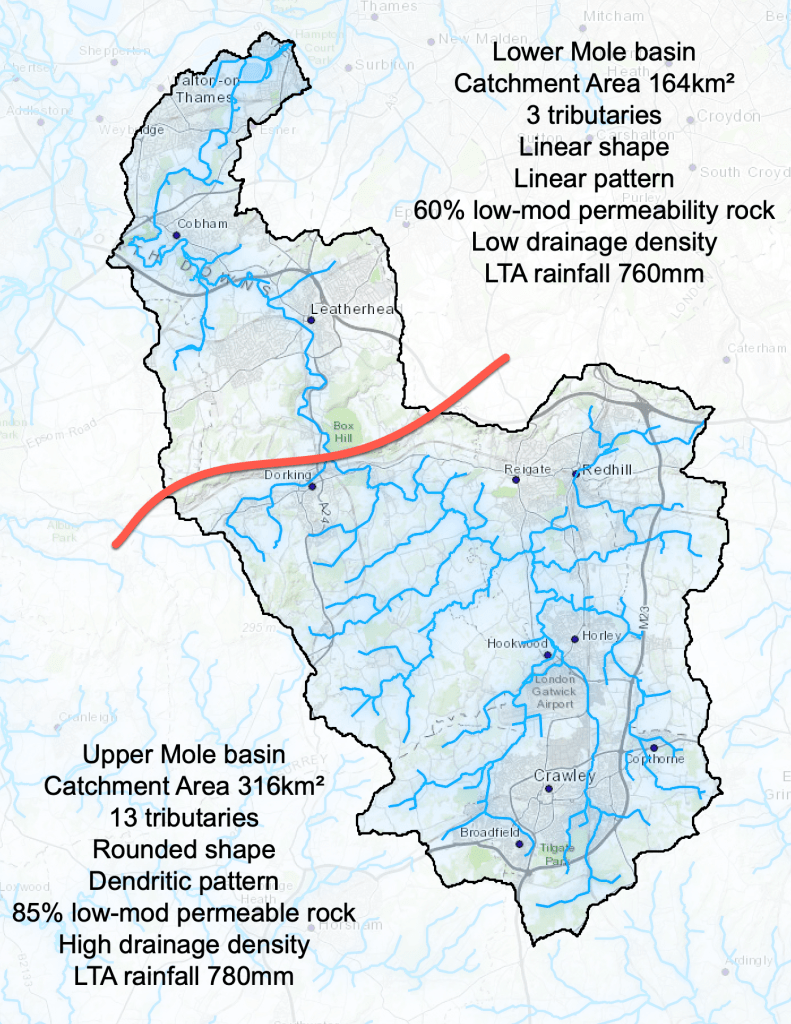
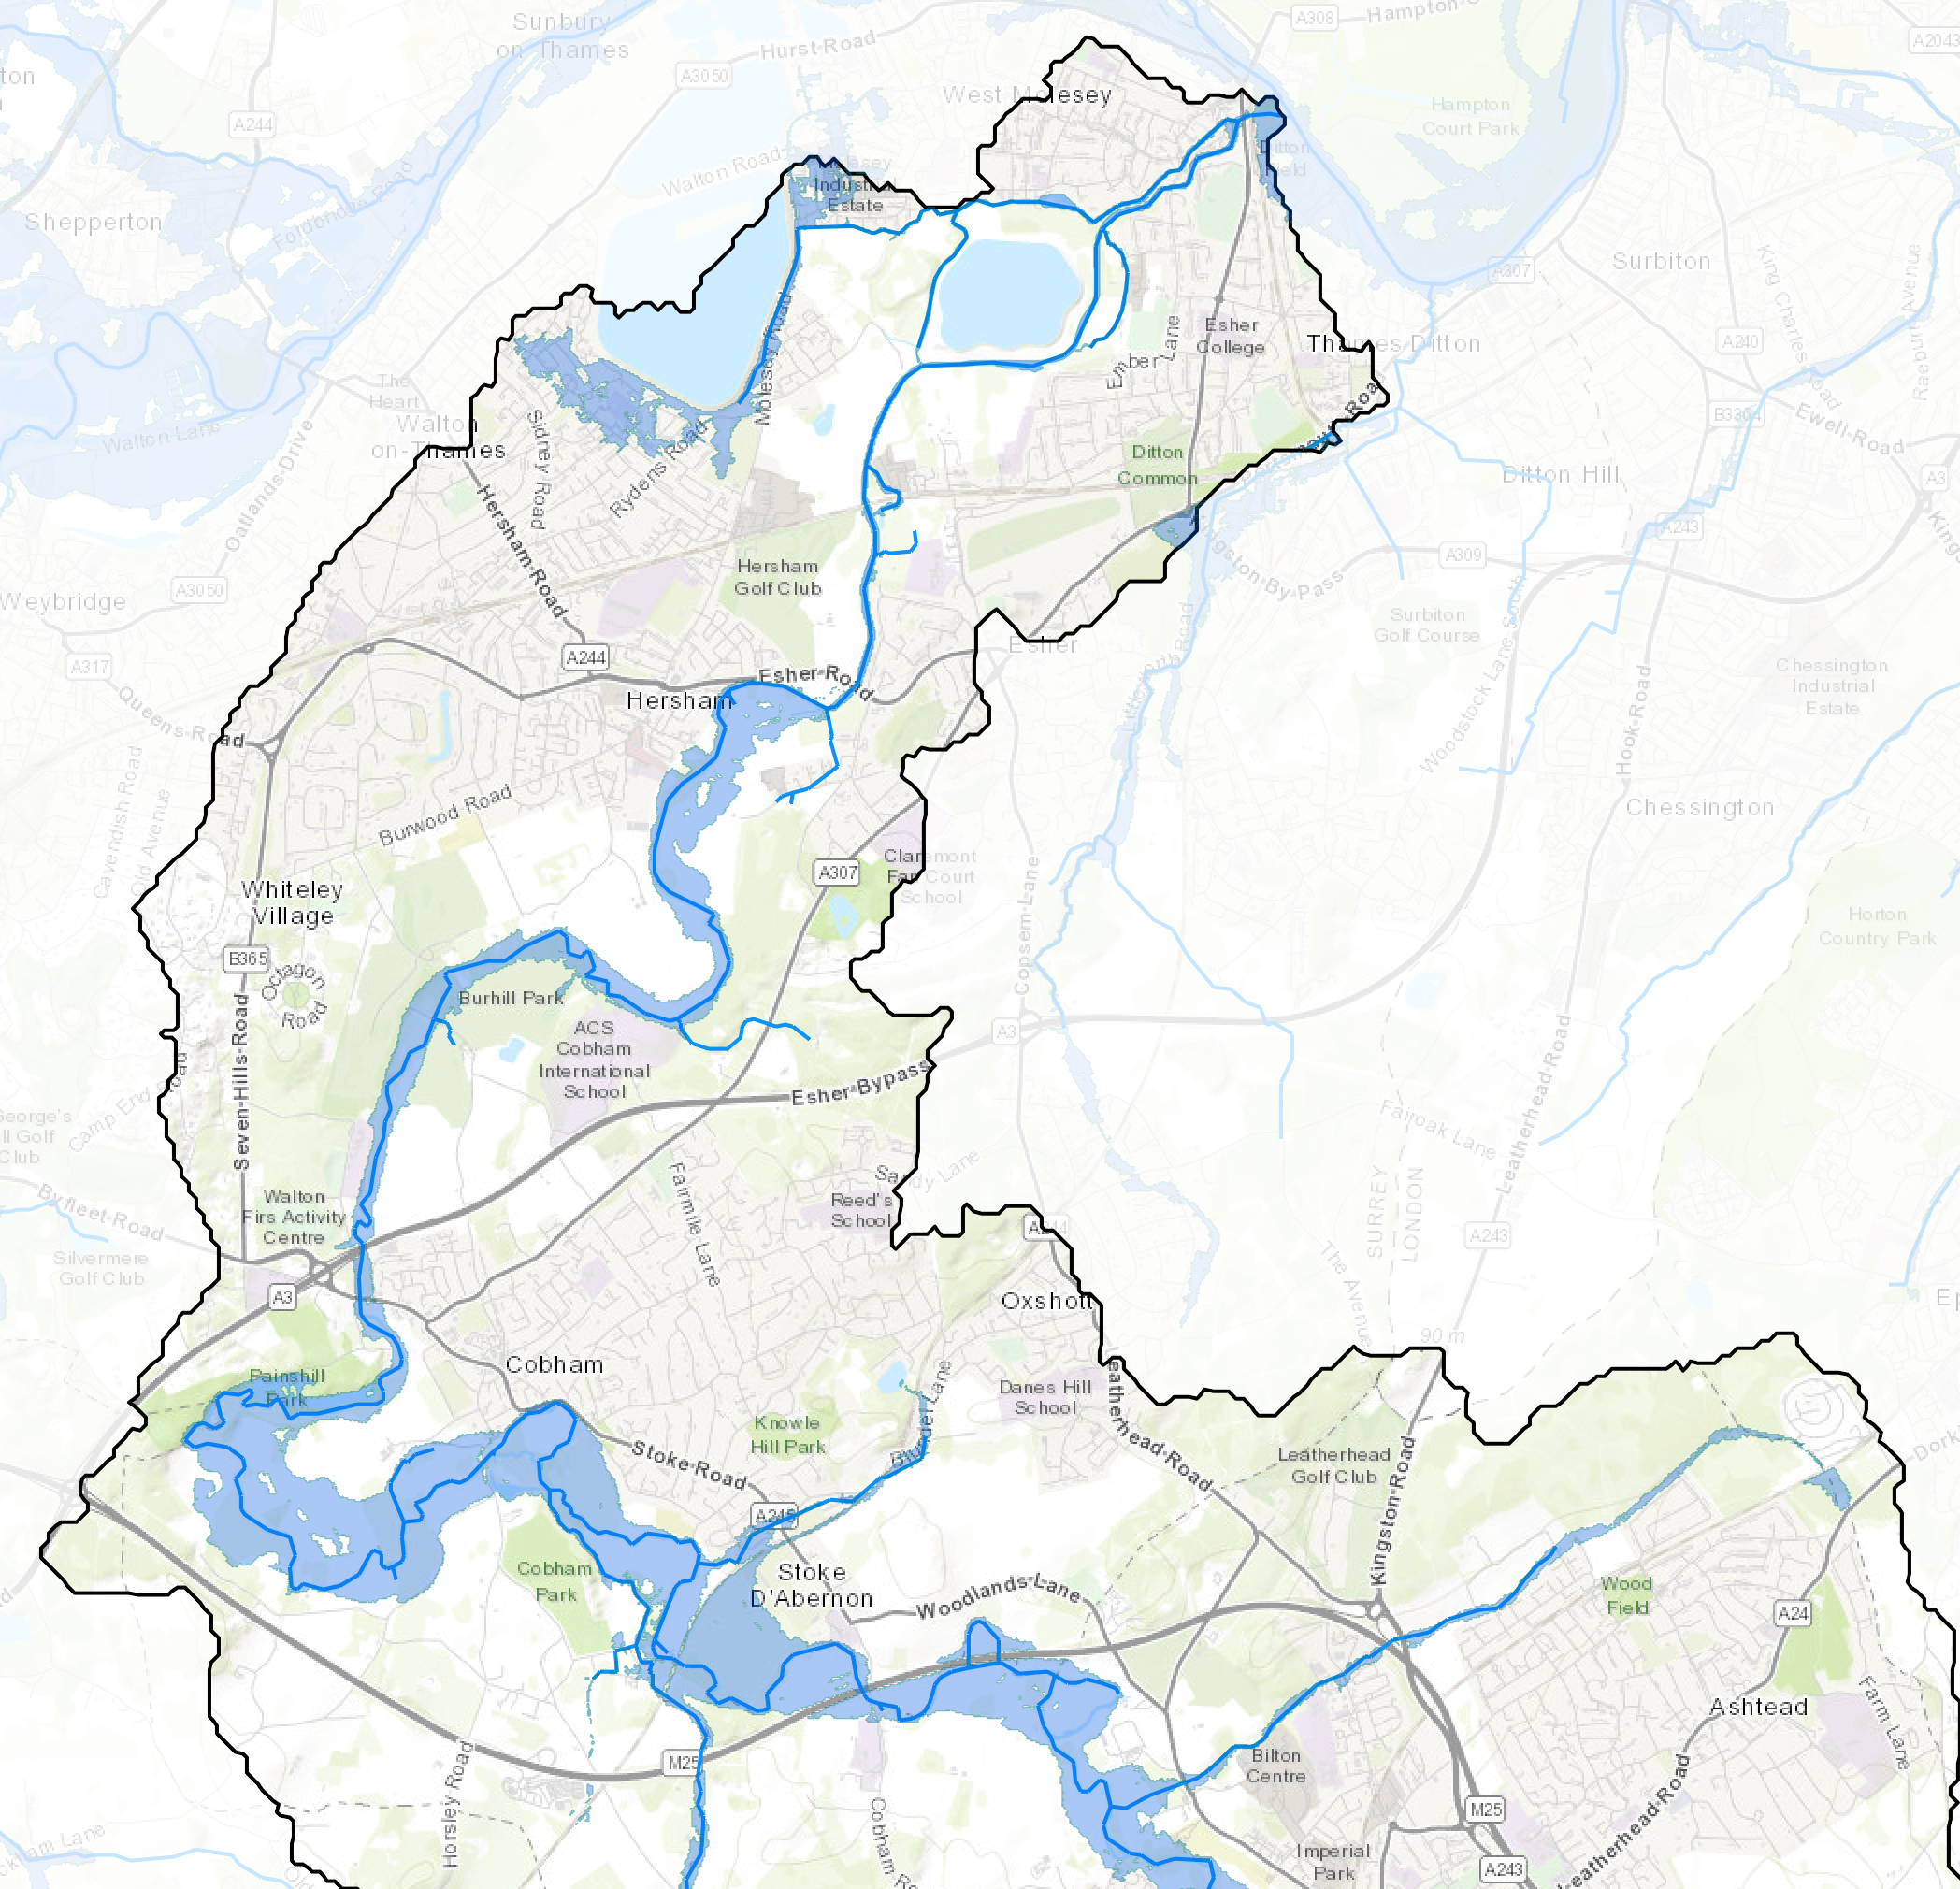
Shape! The Mole catchment is a skewed pear shape with a “fat” Upper Mole basin compared to a skinny Lower Mole basin. The fat Upper Mole south of the Mole Gap covers 316km2 while the Lower Mole (north of the Mole Gap) covers 164km2.
(NOTE: I count the Lower Mole as starting north of the Mole Gap, around Dorking. Reasons for this include the Mole at Dorking being half way between the source (36km upstream) and the confluence with the Thames (44km downstream). In addition, the clear topographic division of the North Downs separates the catchment into two distinct basins. Furthermore, there are distinct changes in geology through the Mole Gap as well as changes in the topography, landscape character and drainage pattern as well as significant changes in land use between these parts of the basin. I should point out that my definition differs from the EA which squeezes the Upper Mole into a diminished area just south of Horley, but I’ll use my def in this blog.)

The Upper Mole basin has a rather more rounded shape than the Lower Mole. Round catchments naturally “catch” more rainfall than skinny linear catchments. Streams in more rounded catchments also have proportionally less far to travel to get to the main channel than streams in skinny basins (with the same area, which is not the case here).
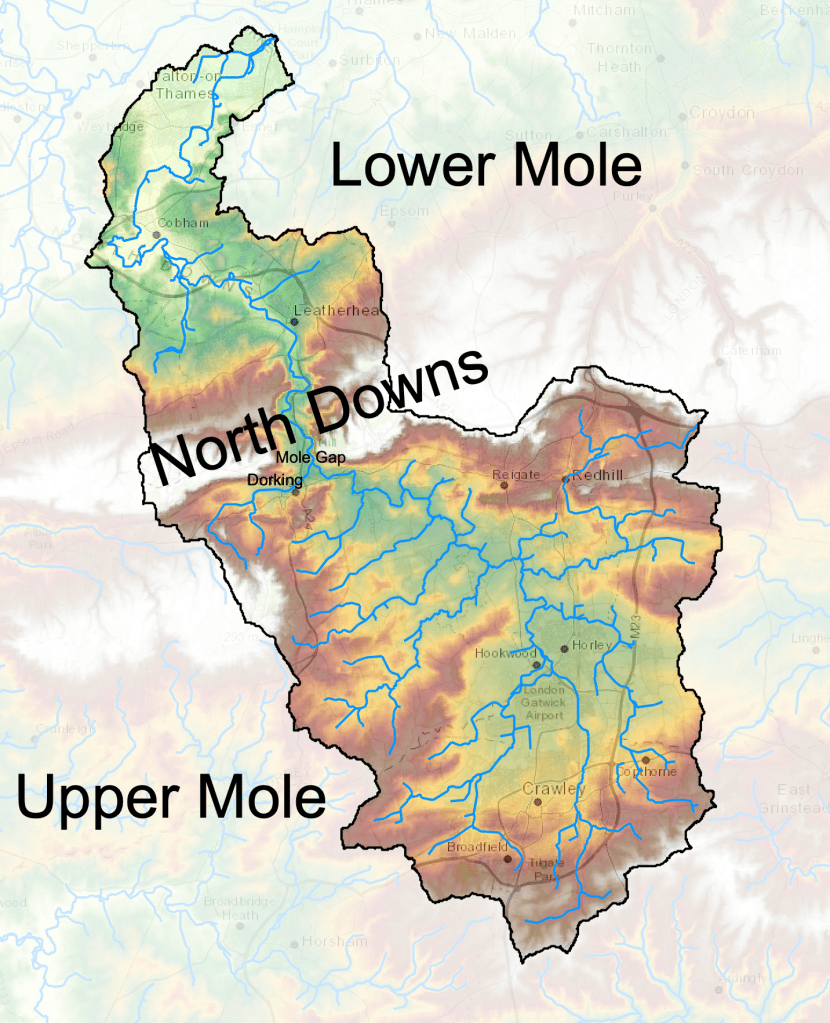
Tree-like stream pattern: If you look at the pattern of streams in the Upper Mole they appear to be “dendritic”… meaning they flow into the basin like the branches of a tree, covering the full range of compass directions. This pattern of streams is more efficient at capturing and delivering rain to the main channel than linear basins. Once in the main channel, water is efficiently moved downstream at a few kilometres per hour straight into the Lower Mole basin. The gradient of streams in the Upper Mole is also greater than those in the Lower Mole basin. Many source streams emerge at above 150m (Pipp Brook being the highest source at 205m aod) and reach 45m at the mouth of the Mole Gap, a descent of 100m. Thereafter, to the confluence with the Thames at 10m aod, involves just 35m descent over 44km… considerably lower gradient, of which 15m of this descent is achieved in 6km through the Mole Gap alone between Dorking (45m) and Leatherhead at 30m aod.
High drainage density: In addition to the round shape encouraging a rapid response to rainfall in the Upper Mole, there are also more tributaries in the Upper Mole, encouraged by the impermeable Clay geology. The drainage density (km of stream length per sq km) is greater in the Upper Mole than the tributary starved Lower Mole. Each tributary in the Upper Mole delivers additional volumes of water. For example, the Gatwick Stream joins the Mole just north of the airport. The Mole and Gatwick Stream are roughly similar in their average discharge and so when they join, the river doubles in size. There are at least ten more tributaries that join the Mole before the Mole Gap at Dorking, each contributing to overall discharge.
Dearth of tributaries: After Pipp Brook in Dorking, due to the permeable Chalk geology of the North Downs, there are no further tributaries through the Mole Gap until The Rye at Leatherhead where impermeable London Clay, plastered over the Chalk, is reached. Thereafter, due to the narrower catchment despite the impermeable London Clay, there are only a handful of tributaries. These include the brooks emerging from the dip slope at Bookham and the Dead River which is basically a ditch that runs through Molesey. These are about the only notable, albeit small, tributaries in the Lower Mole. This means transferring rainfall to the river in the Lower Mole will be a slower process. However, being more urbanised, this effect is probably countered due to urban and road runoff.

It is no surprise therefore that the Mole discharge at Dorking, in a wide range of “normal” conditions, is already 70% or more of the total flow that reaches the Thames. In other words, in most conditions the Lower Mole contributes only 30% more flow to total river discharge. The Upper Mole in most conditions contributes most of the discharge to the River Mole. What flows over the weir at Dorking forms the bulk of water flowing into the Thames over 40km further downstream, not much more discharge is added thereafter.
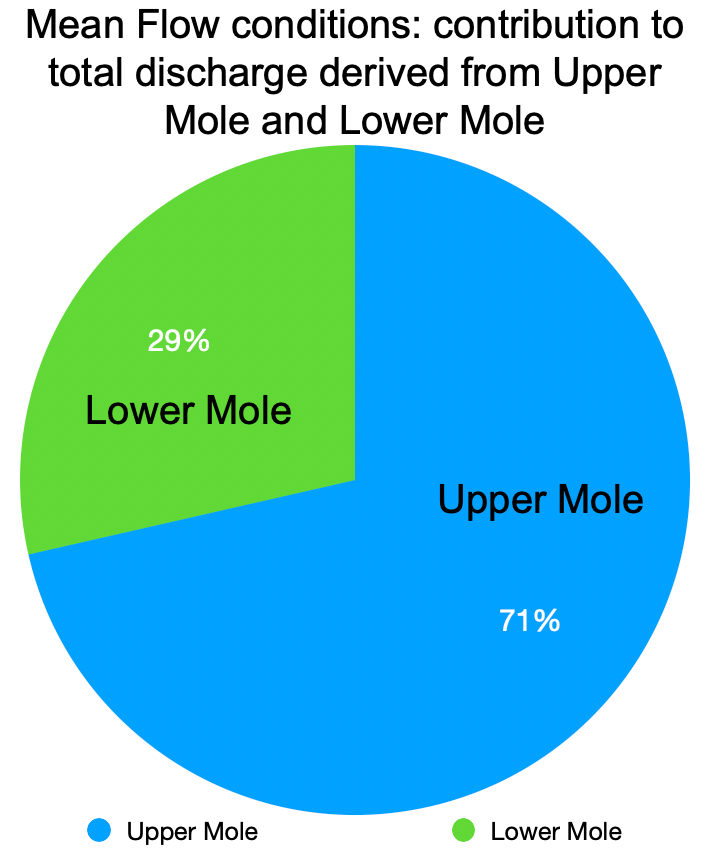

This is shown by average flow at key gauging stations, shown in the pie chart on the left. The average flow at Leatherhead, as the river leaves the upper catchment, is nearly 4m³/s while at Esher, over 26km further downstream and well into the Lower Mole catchment, the average flow is still only 5.5m³/s. Only a further 1.5m³/s is added through the course of the Lower Mole, more than half the length of the whole river.

At peak discharge, when flood peaks move past a gauge, the relative contribution of the Upper Mole is even more pronounced, as shown by the pie chart above. It is common for Leatherhead to recording almost the same peak discharge as that at Esher. For example, for selected peak discharge events recorded from November 2022 to May 2023 some 86% of the total flow was already “in-channel” at Leatherhead with only 14% more flow added through the remaining 35km downstream. This shows that most water in the Lower Mole, especially during times of peak discharge, is sourced from rain falling in the Upper Mole.
Possible reasons for the Lower Mole catchment’s limited contribution to flow are the narrow shape, the low gradient, permeable surrounding hills and dearth of tributaries. It also offers little areal extent to capture more rainfall, as the Lower Mole accounts less than 30% of the total area of the whole catchment.

With few tributaries adding more water, the only other sources contributing to Lower Mole discharge are groundwater (e.g. resurgence at Leatherhead from Chalk), effluent discharge from sewage works (large works at Leatherhead and Esher will add to flow), urban and road runoff from drains (probably significant), possible transfers from neighbouring reservoirs (unknown but Island Barn Reservoir has an emergency discharge permit into the Mole) and direct precipitation into the channel (which is a a very small proportion of total discharge).

Geology plays an important part in discharge. The impermeable clay of the Upper Mole is a primary cause of it’s position as the dominant source of discharge in the whole Mole.
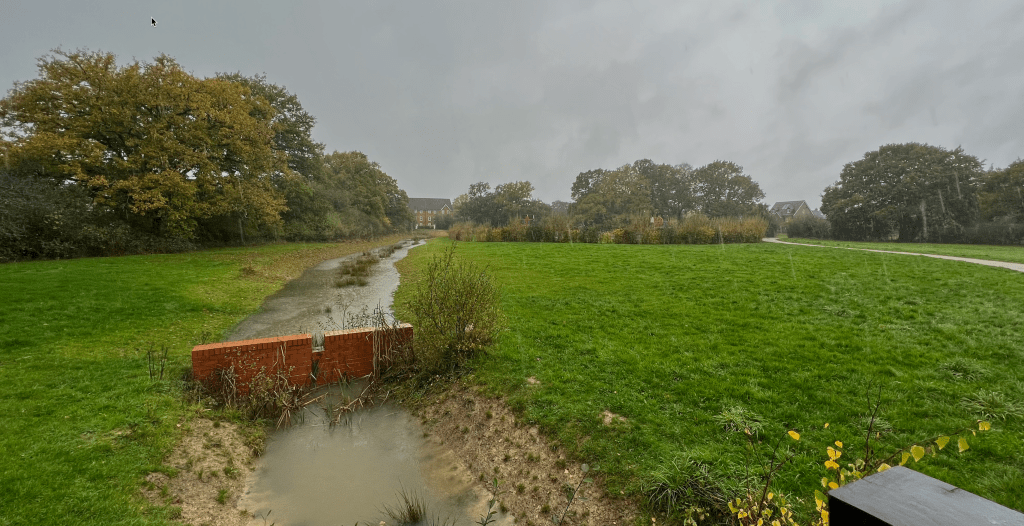
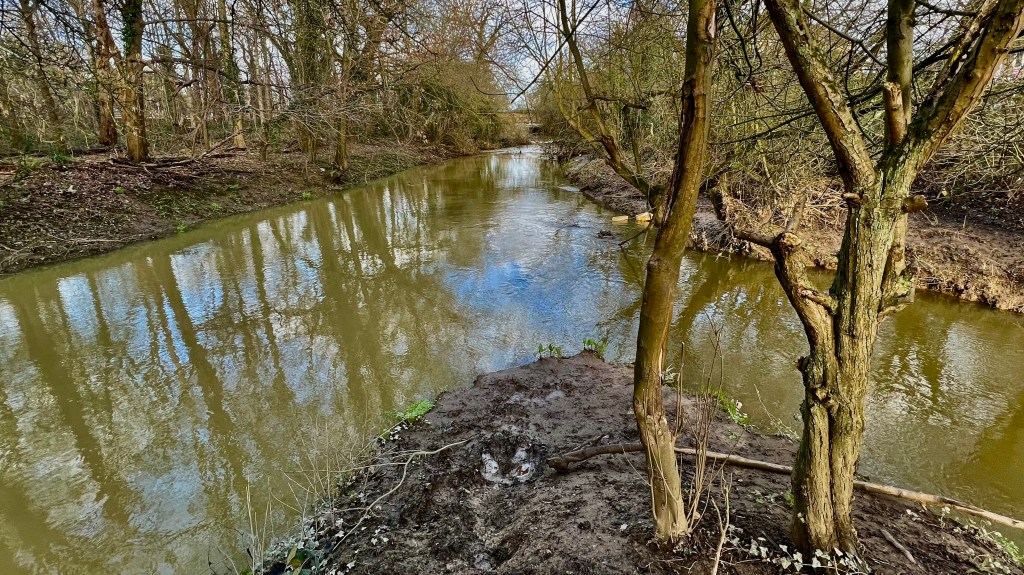
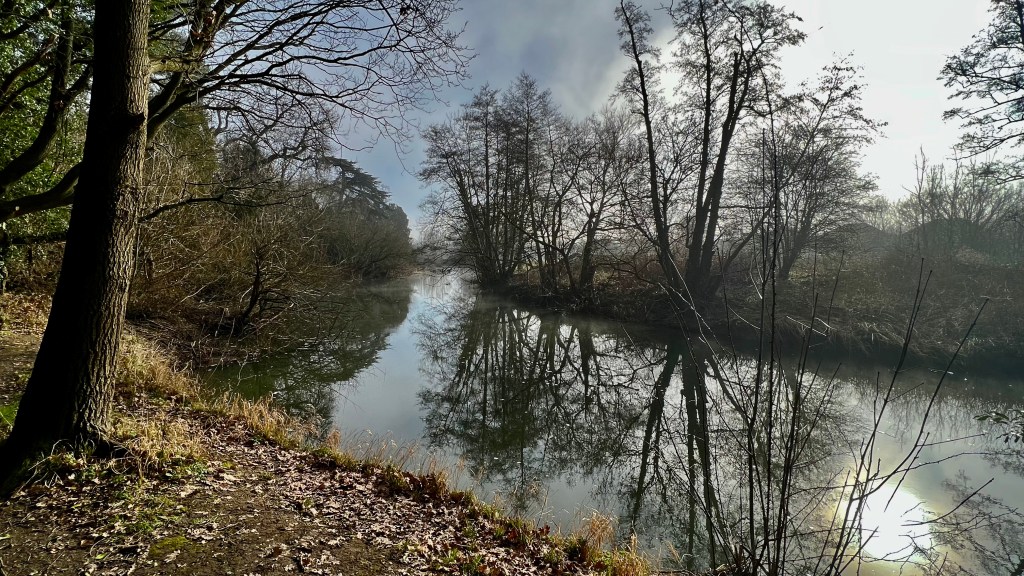
Being mostly impermeable clay, the base flow portion of the Upper Mole is less than 20% meaning most of the river discharge derives directly from rainfall and comes from surface overland flow or road runoff and drains, by far the quickest way to get water into a river. The photos below show the Gatwick Stream and Broadfield Brook in Crawley, both highly engineered streams with frequent drains and urban runoff contributing rapidly to flow.


The clay geology provides the Mole with its flashy characteristics: rising and falling rapidly after rain as runoff quickly travels over largely impermeable surfaces to water courses.
The Chalk and Greensand geology of the Mole Gap temporarily reduces the overland flow portion of runoff into the Lower Mole but most of this lost discharge at times of low water table almost certainly resurges downstream, at Leatherhead along with other groundwater sources that provide some 50% of the added flow in the lower reaches.
So, the overall story is that if you look at the River Mole at Esher or Molesey, the water flowing past you has mostly fallen as rain somewhere over the Upper Mole catchment. Little is derived locally. This might seem obvious but the effect is greater in the Mole because of its shape, geology and topographic layout.
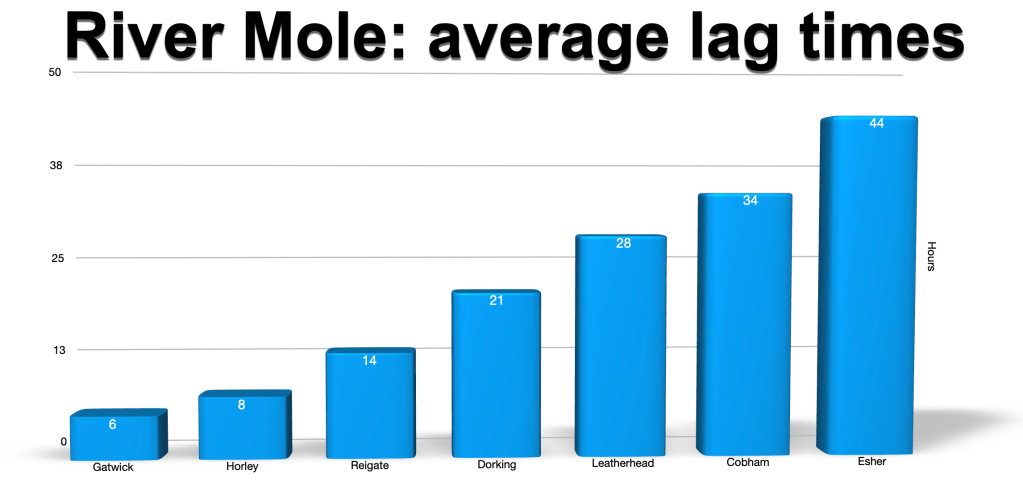
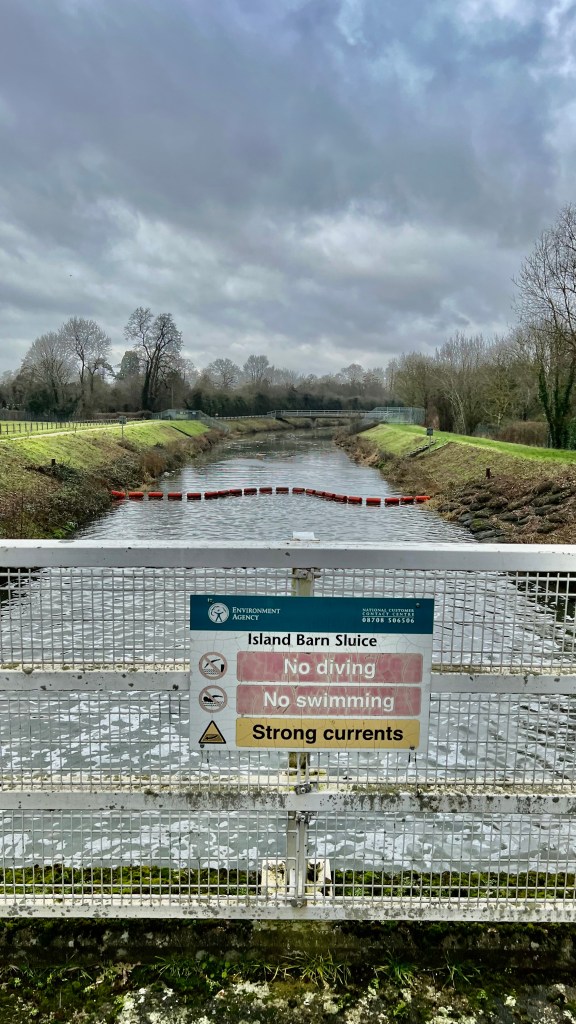
This characteristic is why lag times are important for flood control in the Lower Mole catchment. The average time taken for peak discharge to reach gauging stations is shown above. A significant rainfall event in the Upper Mole, will take over 24 hours to reach the Lower Mole. The Lower Mole Flood Alleviation Scheme (LMFAS) takes advantage of this lag time with sluices, the first of which is just downstream of the Esher Road bridge, lowering the level of the River Ember flood relief channel ahead of flood peaks arriving from the Upper Mole.

The Ember works as a flood storage reservoir which, if prepared by lowering beforehand, can accommodate flood peaks arriving from upstream so that it does not spill onto the flood plain. This has worked effectively to control frequent high probability flooding (Flood Zone 3) of up to around a 1:100 year return period in the area since the 1980’s when it was built. A low probability higher impact event, say 1:200 year or more, might still cause flooding as shown on the flood maps above.
The LMFAS is designed to take advantage of the Upper Mole’s control over discharge. However, it also highlights an important exception to the rule that the Upper Mole controls flow through the catchment. In catchment-wide severe flood conditions, the lower course of the river appears to accommodated the bulk of discharge. For example, in 2013 the Lower Mole discharge at Esher was 147m³/s while at Leatherhead, discharge leaving the Upper Mole, was running at 62m³/s. The volume of water in the Lower Mole therefore accounted for well over half the total discharge into the Thames. Notwithstanding the obvious point that flood water travels downstream and lands up retained in the flood plain, this nevertheless does run counter to the pattern. Perhaps retention in the Ember flood storage channel might account for part of the reason.

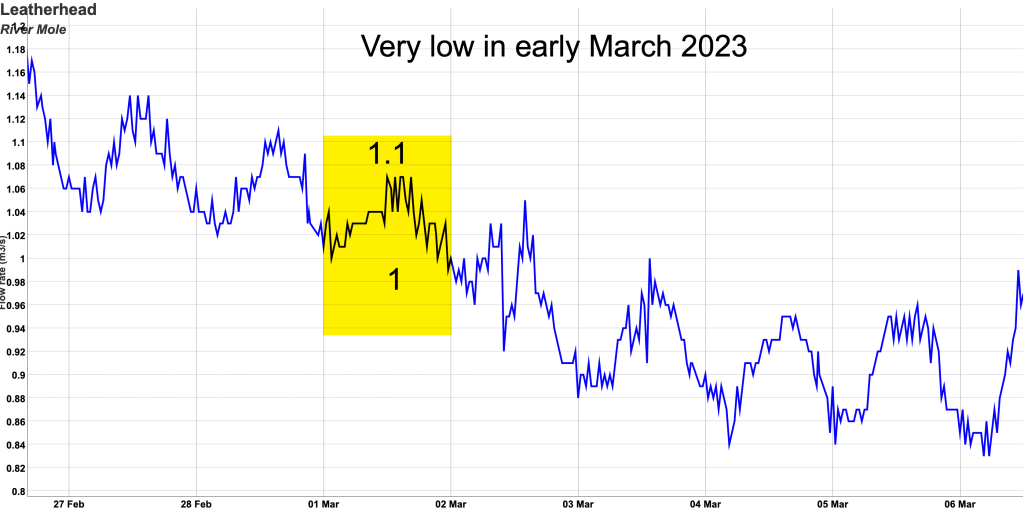
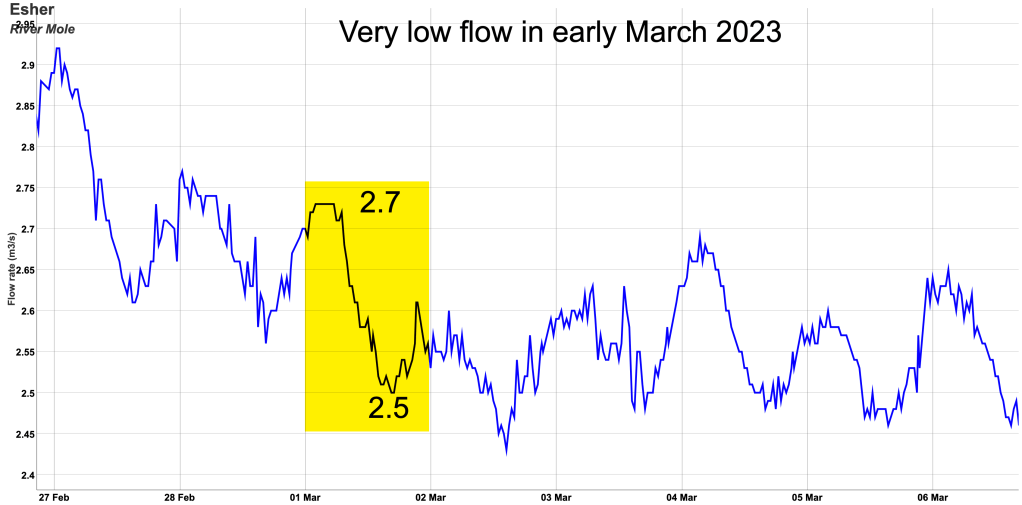
The other notable exception to the Upper Mole dominating the contribution to total catchment flow is when the river is at very low flow. At low flow the balance changes because groundwater flow and effluent discharge from sewage works form a greater proportion of discharge while rain runoff ceases to be important.

During low flow conditions, more water arrives in the Lower Mole from sources other than rainfall runoff, which has effectively “dried up”. This suggests the contribution of the Upper Mole to the total flow is considerably less during dry spells. February 2023, for example, was an exceptionally dry month. The charts below show discharge at Leatherhead and Esher dropping so low that levels started to show the daily rhythms of sewage effluent discharge augmenting natural flow. The ups and downs occur after the population’s morning “wash and flush”. The range between the daily high and low effluent “tides” is particularly noticeable at Esher in the Lower Mole. Presumably this is because a greater population density and larger sewage works means the contribution to discharge is greater.
Here are some other uncertainties regarding catchment flows.
An important unknown regarding a full accounting of the origin of catchment discharge are inter-basin flows. This is where transfers occur from water companies outside the Mole catchment which might contribute to river flow. Inter-basin transfer happens in the Upper Mole with some 15% of SESW supply being transferred from Bough Beech Reservoir in the Medway catchment into the Mole catchment, some 25 million litres per day. This means 0.3m³/s is potentially added to the flow of the Upper Mole from this external source. In very low flow conditions this, in addition to 140+ million litres per day of water abstracted from aquifers (SESW), would be significant in keeping the river flowing in its upper course. Unfortunately, I’m not aware of figures for direct inter-basin transfers into the Lower Mole.
Another uncertainty for me is the origin of base flow in the Lower Mole. The base flow index (BFI) in the Lower Mole is 0.5, this means up to 50% of the discharge from this sub-catchment derives “naturally” from permeable rock sources associated with the North Downs. So, of the discharge added in the Lower Mole catchment in normal conditions, on average half of it derives from groundwater. In low flow conditions, a greater proportion of “natural” flow in the Lower Mole is likely to be derived from groundwater as surface sources dry up. Remember that surface runoff forms the bulk of the flow in the Upper Mole and, as these dry up, so the contribution of the Upper Mole to overall total discharge will be reduced.
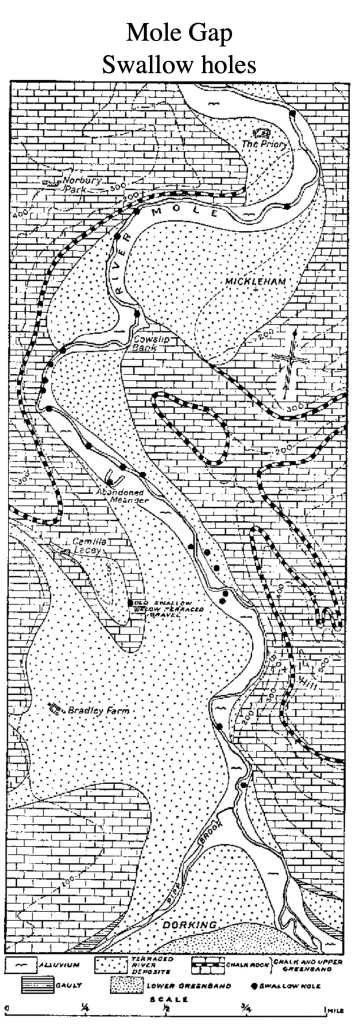
A further uncertainty hampering a full picture of the provenance of river discharge includes the loss of flow into chalk swallow holes in the Mole Gap. There are figures suggesting a proportion of discharge is lost to groundwater through the Mole Gap especially (or entirely?) during periods of low water table. However, while some flow disappears into swallow holes, much is known to resurge back into the river through springs around Leatherhead. So the overall impact of swallow holes on total discharge is likely to be quite small, it seems to be a temporary plumbing issue restricted to the Mole Gap rather than a permanent abstraction of discharge from the river. This is an area which needs more research as the internal plumbing of the Chalk north of Dorking through the Mole Gap remains an intriguing local mystery! Any leads or refs welcome.
In this post we started by looking at how storms last week translated downstream. I have argued that the Upper Mole dominates flow downstream in all but extremely high or low flow conditions. I’ve also outlined some of the hydrological characteristics of the Mole catchment and how these control flows. Finally, I have highlighted some uncertainties which, to me, show there is a long way to go before we can be certain of all flows in our fascinating River Mole catchment.

Leave a reply to Nicholas Lewis Cancel reply