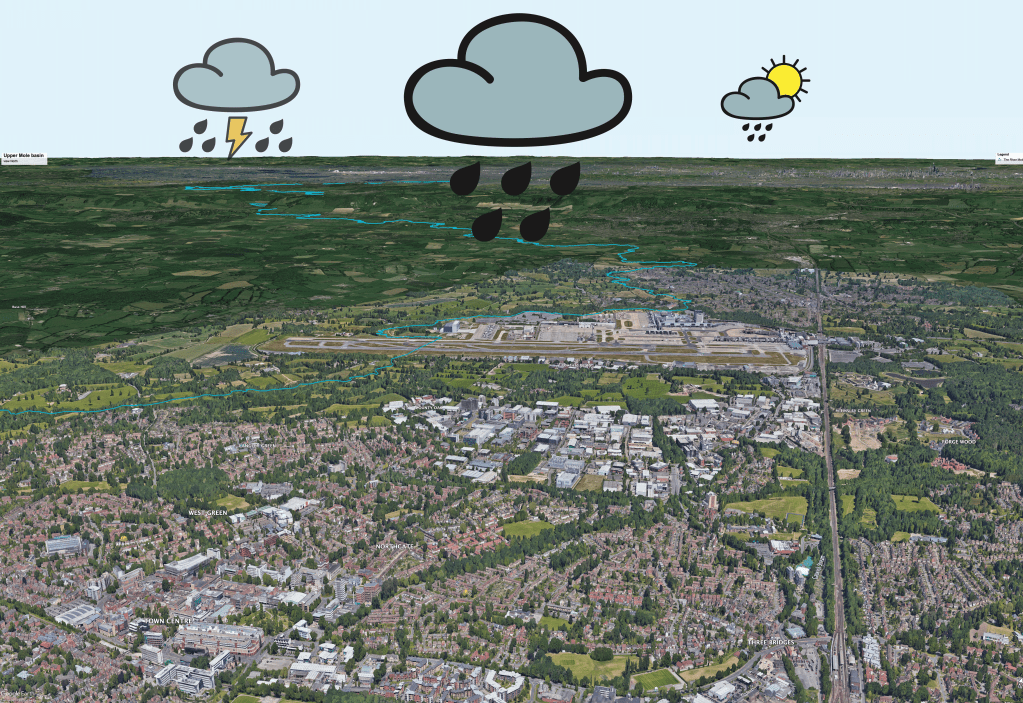
The River Mole is a flashy river! This means levels rise quickly after rain falls over the catchment. The hydrograph below shows the River Mole discharge at Gatwick gauging station rising quickly after a heavy squall line passed over the catchment, dropping 11mm in less than 1 hour. This is not outside normal rainfall but the river here started rising within 30 minutes of heavy rain arriving and rose to a peak discharge in less than 6 hours. This is a flashy response. This post will dive deeper into Mole response and what are called “lag times” and explore some interesting characteristics of our local flashy river.
I try to research and write my posts carefully, checking and editing for accuracy. This takes time so IF you like this post then I’d be delighted if you LIKE and subscribe to my blog (at the foot of the post) and do leave comments to help me. Thank you for your time.
Simon

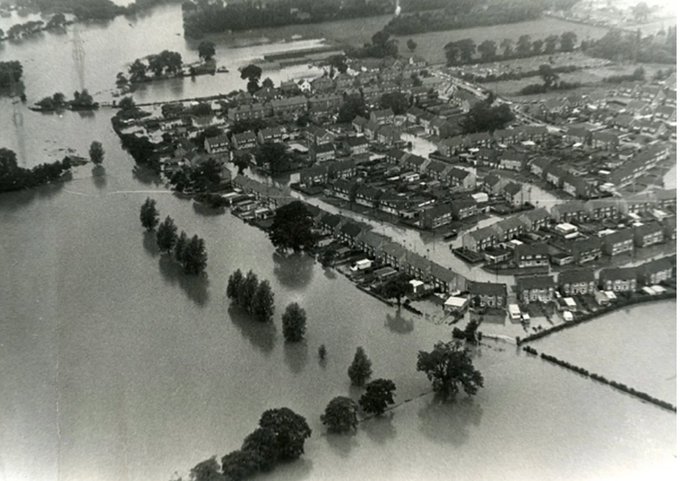
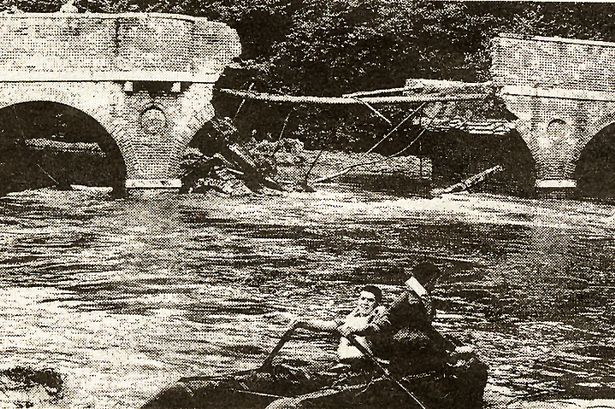
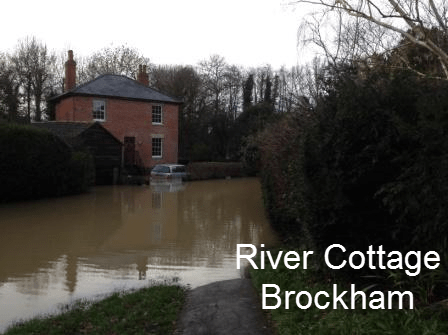
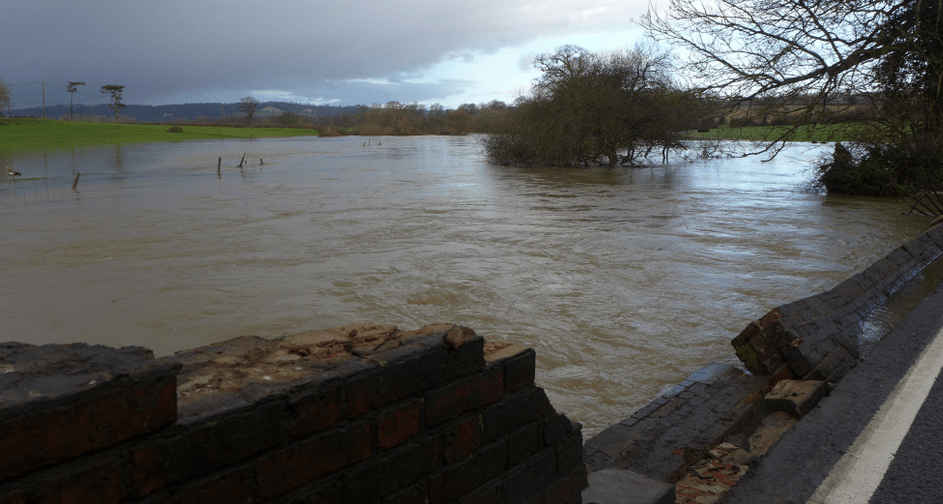
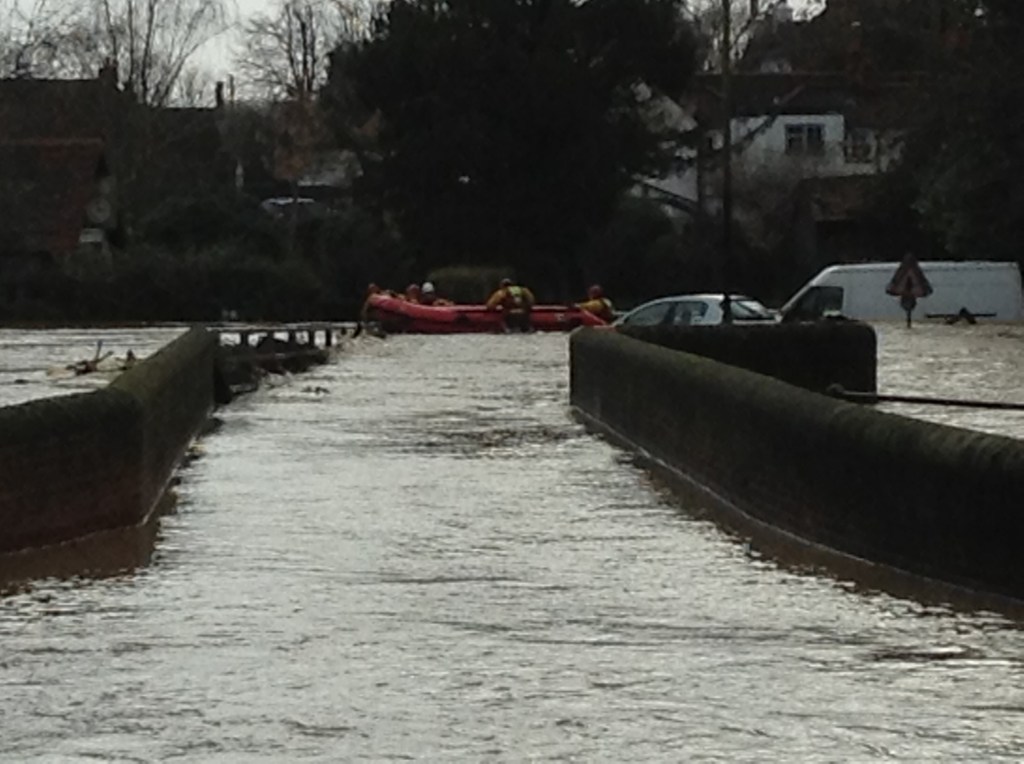
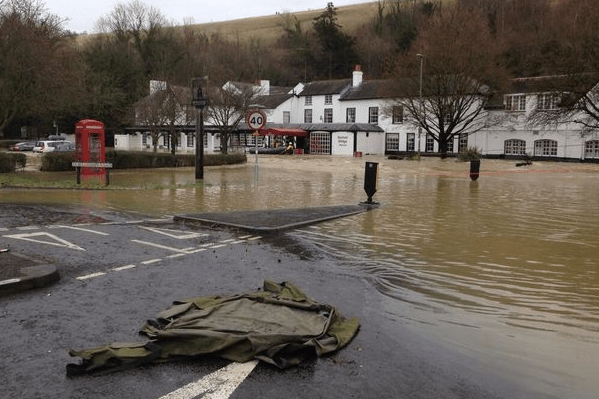
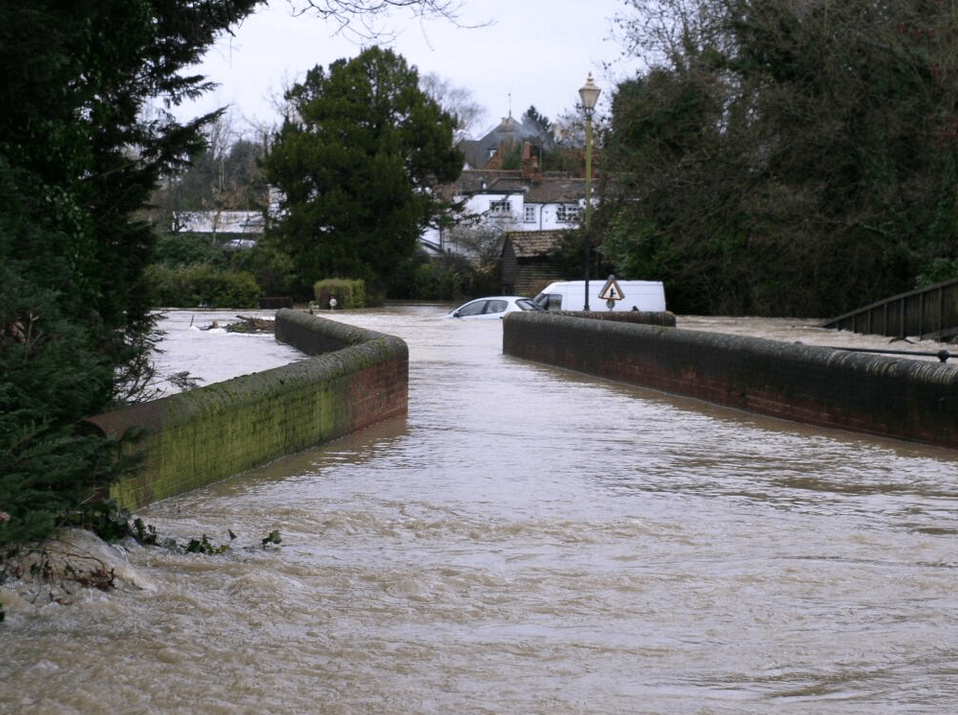
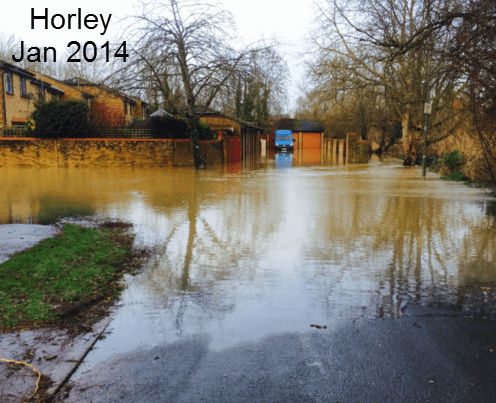
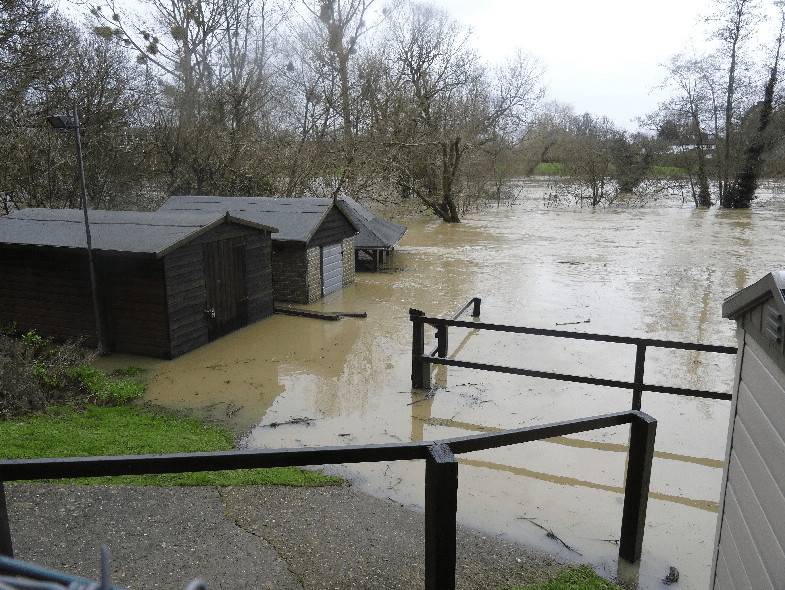
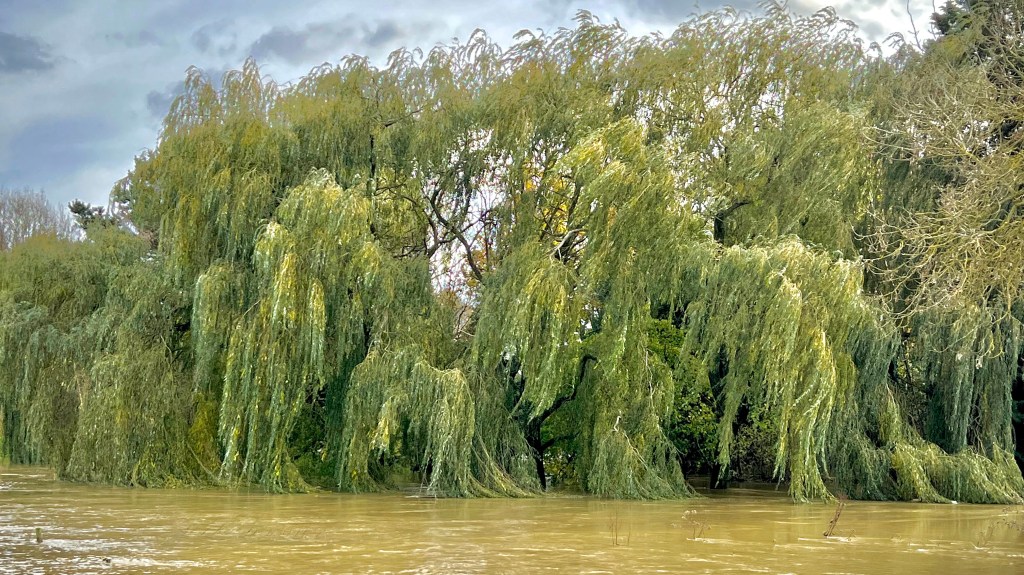
Flashy rivers are associated with flooding and the Mole and her tributaries can certainly behave badly on occasions. There are natural reasons for her flashiness but also human activities play a big part in speeding up our local river’s response to rain. Here are some photos of the Mole showing the results of rapid rises in river level over the years. Exploring how the River Mole responds and how quickly flood surges flow downstream is interesting and probably important, so there is a lot to talk about and I am finding out new things all the time so this is a summary so far.


Why is the Mole so flashy?
Rivers rise when it rains but it takes time for levels to go up once rain starts. This is because the vast majority of water falls on land some distance away from streams and it must then find its way to the river through a myriad of varied routes, some fast, some very slow indeed.

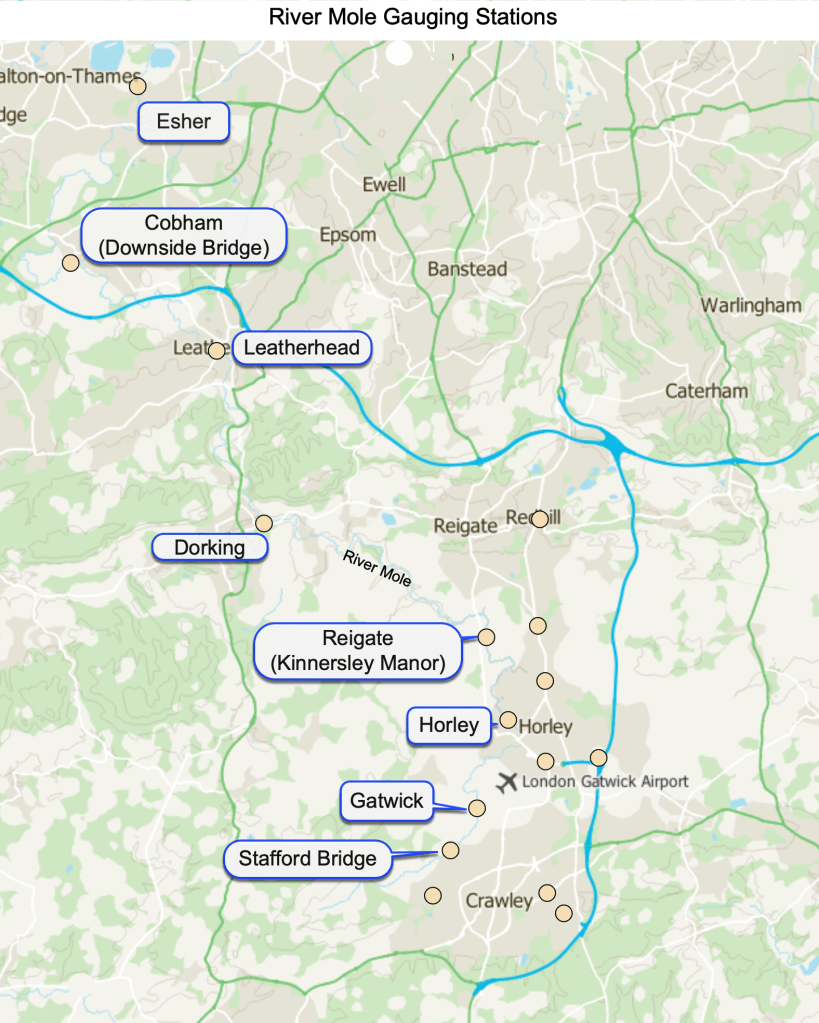
Size of drainage basin means a lot! At only 500km², the Mole catchment area is half the size of the neighbouring 1000km² Wey catchment. This means water hasn’t got far to travel from anywhere inside the watershed to reach a river. The Mole has a dense network of tributaries collecting rain efficiently from relatively high hills to the south of Crawley and the western part of the catchment on the Redlands slopes of Leith Hill. Several of these hills exceed 250m. The density of streams, size and relatively steep slopes all contribute to rainfall being efficiently channeled to nearby streams relatively quickly.

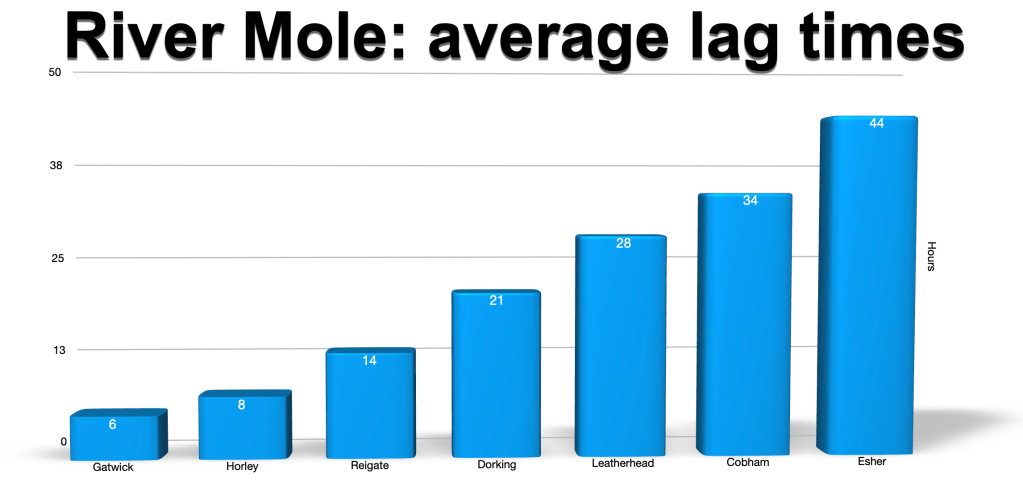
Once in the river, for example near the source at Rusper, it is less than 10km downstream to Gatwick, 15km to Horley, 35km to Dorking, 55km to Cobham and 70km to Esher. It varies, but on average the river flows at 1.5kmh so water can flush downstream into the Thames in around two days. But there’s even more to speed things up further…!
It won’t sink in! Over 65% of the Upper Mole catchment has “very low permeability bedrock and surface deposits” such as the Weald and London Clays and Lower Greensand, compared with just 16% for the neighbouring River Wey which has a largely permeable catchment and is altogether less flashy!
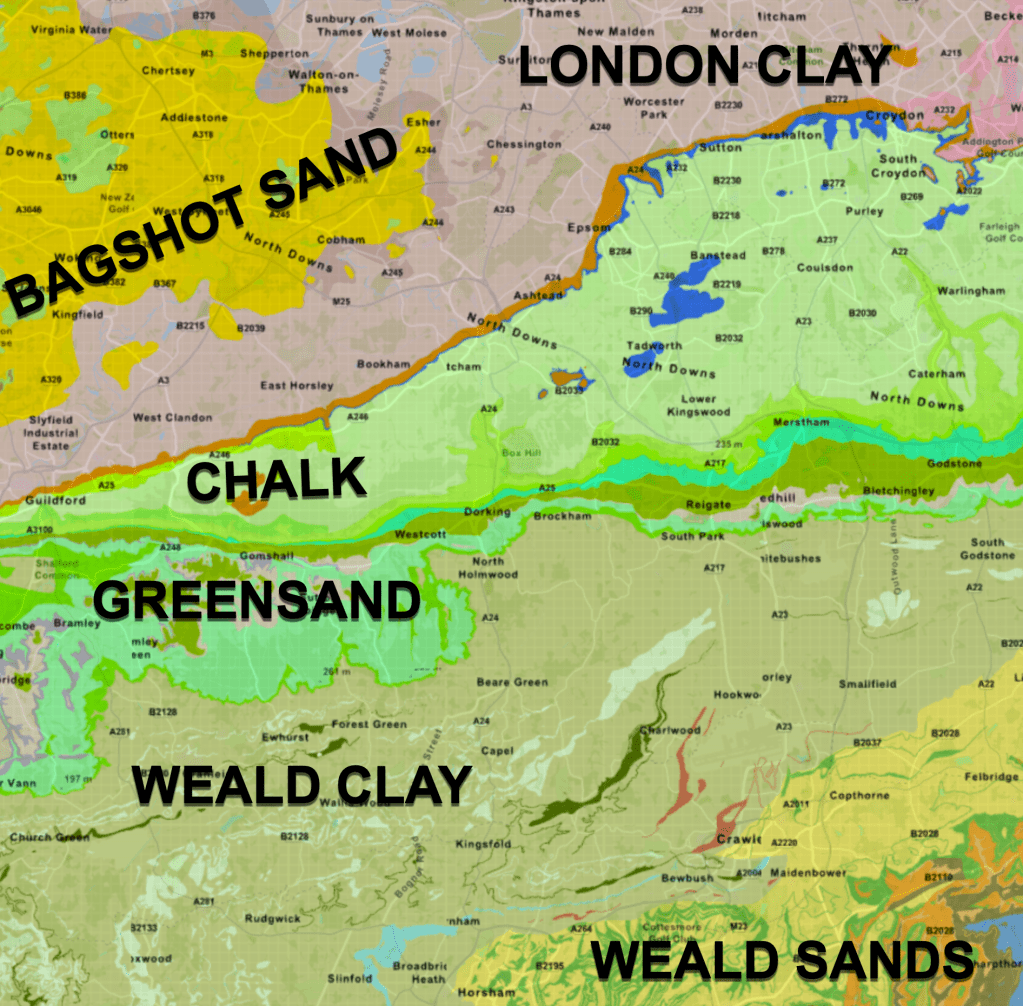
The impermeable rocks permit little infiltration into bedrock so more runoff occurs across the surface, getting water to the river more quickly.

While it’s not the Himalayas, the Mole catchment has relatively steep slopes and elevations over 250m surrounding the river basin especially to the south and west edges of the watershed.
Water travels downstream more quickly and efficiently on steeper slopes. The gradient of the river channel itself is shown in the profile above (ignore the bumps, the are exaggerated from a google earth elevation profile, but the overall gradient changes are faithful). It is steepest near the source, flattens out noticeably through Gatwick and then steepens through the Mole Gap before continuing to drop purposefully through to Cobham. This by the way is the reason why Leatherhead could never be affected by flood schemes in the Lower Mole… it’s way too steep for water to “back up”, which was suggested after floods in 2013).

At over 200m, the highest source of the River Mole is that of the Pippbrook on Leith Hill near Coldharbour. Pippbrook flows north then east through Dorking and joins the Mole before entering the mouth of the Mole Gap.
The rocks, gradient and shape discussed above are static factors which are fixed, at least on human timescales. They form the foundation to how the river behaves. Other dynamic factors controlling rate of runoff are to do with human development and land use in the Mole valley, that’s to do with the lives of everyone living in the drainage basin including me and probably you as you’ve read this far.

While Surrey is a wooded county overall, nearly a quarter of the land cover in the Mole catchment is impermeable urban surface. This compares with just 16% urban land cover in the Wey catchment. Urban areas in the past were designed to channel water into rivers as quickly as possible to avoid local flooding, but unmanaged this can decrease lag time and therefore increase flooding downstream.
“Urban extent almost doubled between 1960 and 2002. Levels respond quickly to rainfall”
NRFA Kinnersley Manor catchment description
Towns such as Crawley, Horley, Reigate and Redhill, the housing and associated roads and motorways such as the M23 and M25, Gatwick Airport and Manor Royal industrial estate, all contribute to the hard surfaces which, unabated, encourage rapid runoff and a more flashy Mole.
On average, it takes about 50 hours for rain falling over the upper tributaries, around Crawley, to reach the “end of the Mole” where she meets the River Thames at Hampton Court, a distance of 80km downstream. This suggests a stately speed of less than 2km/h but, whilst that doesn’t sound much, it is enough to move over half a million cubic metres of water a day into the Thames! In flood the Lower Mole can exceed 5 million cubic metres per day in the lower reaches!

These incredible quantities of water clearly show how any small increase in speeding up river response time by unmanaged development such as driveways, connecting new estates to storm sewers with no sustainable urban design, unabated flooding off roads into drains and so on could mean much more water reaching the river more quickly…potentially causing bigger floods, something we all want to avoid especially as rainfall is likely to become more intense with climate change.
So, how flashy is the Mole?
Before we look at exactly how flashy the Mole is to rainfall, here are a few basic technical terms:
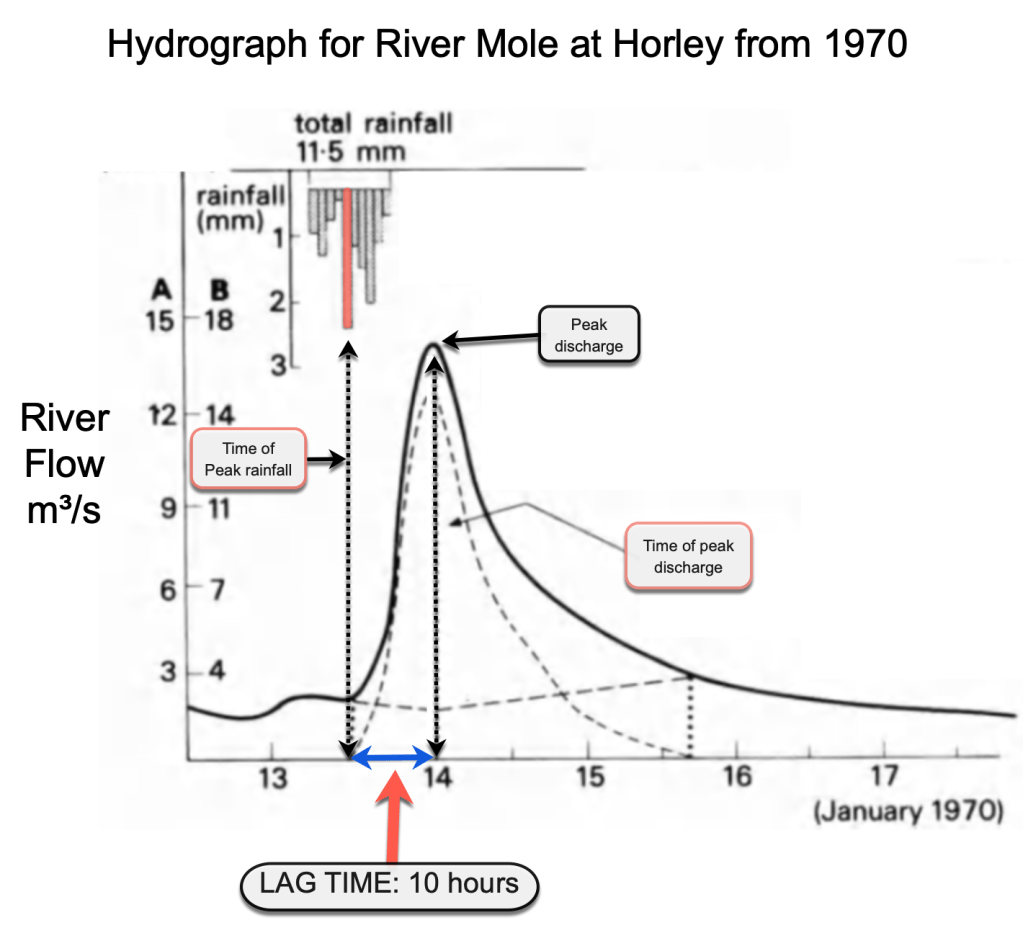
Hydrographs are charts that show how rivers rise and fall at a gauging station. The example above shows the rapid rise of the River Mole at Horley after rainfall from 13-17 January 1970.
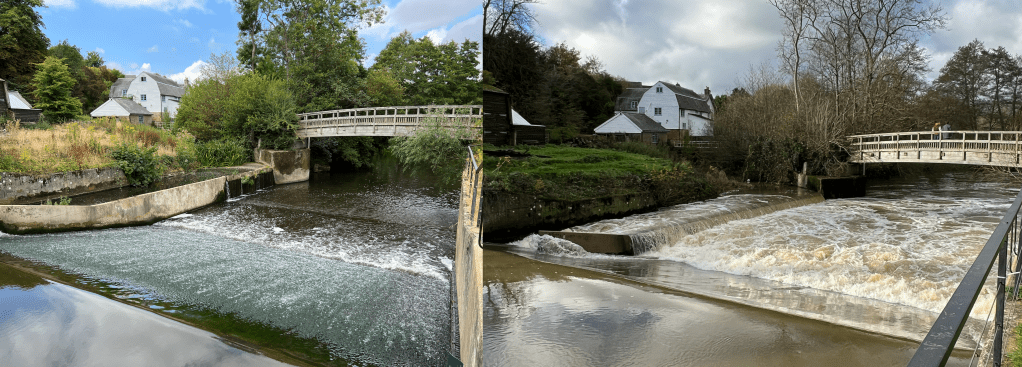
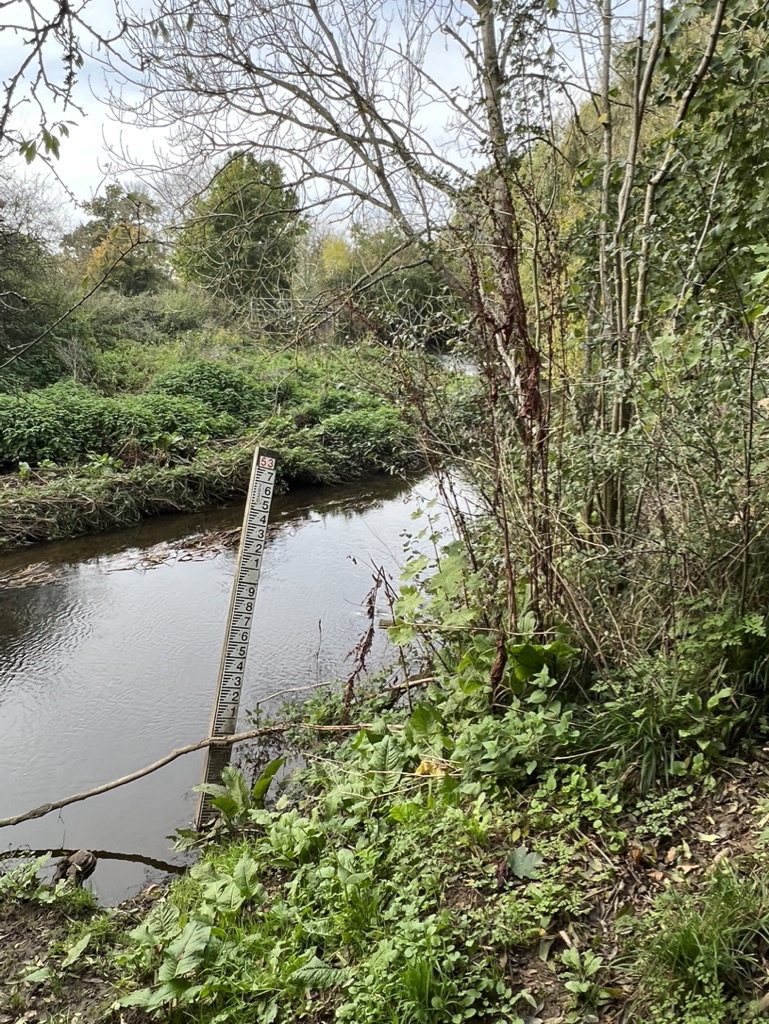
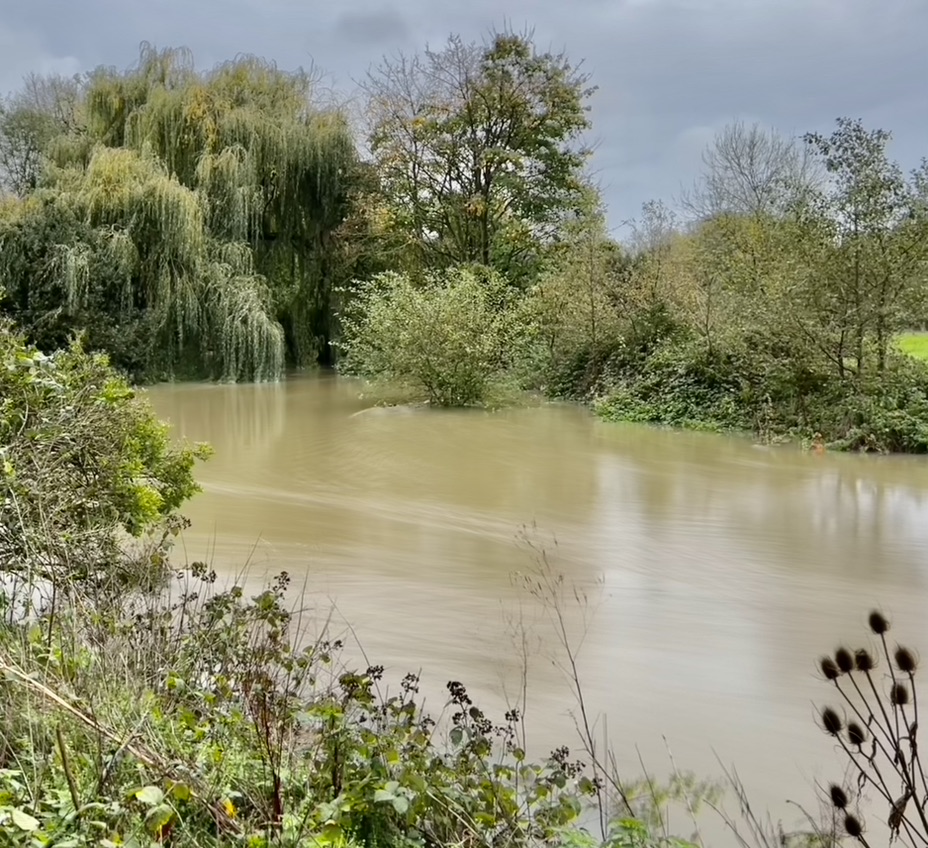
The time it takes for rivers to respond to rain is called “Lag Time”. It is a measure of the time between peak rainfall (mm/hr) and peak discharge (m³/s). The hydrograph above shows peak rainfall in the Mole basin occurring at 1pm on 13 Jan and the Mole rising quickly to reach a peak discharge at the Horley gauging station at around 11pm, a lag time of about 10 hours. (Below are photos of Horley gauging station taken in Nov 2022 with the river in normal flow and spate also taken in November.)

Lag time is based on the assumption that the heaviest rain which fell at 1pm is the same body of water raising levels to peak discharge at Horley gauging station 10 hours later at 11pm. Lag time is a useful measure because it shows how quickly rivers can flood and what imminent warning people might get of a flood. Changes to lag times might also be a good proxy record to investigate the impact of changes to the river basin over time due to changes in land cover or even intensity of rain.
For instance, my calculations show the mean lag time for Horley is now 8 hours compared with the 10 hours recorded in 1970. Obviously this would need more investigation to be certain of any change and the causes.
Nowadays there are gauging stations at regular intervals on the River Mole and several more on important tributaries. Each automatic station continuously records the level of the river.
River levels are available from several different websites, these are my favourites:
- GaugeMap: good snaphot of levels, shows levels likely to cause flooding.
- Check-for-flooding.service.gov.uk: official Gov site, responsive graphics.
- Flood Assist river data: new and shows good recent historic record for each station.
- National River Flow Archive official site for gauging station info. Lots of river info for each location.
- EA hydrology data explorer good interactive time series for selected stations in cumecs
- UK reconstructed hydrology data explorer slightly different, shows historic data for selected NRFA stations.
On most of these websites river levels are available in “m asd” (metres above stage datum) which measures water level as metres above the level of the river bed at that location. Some gauging stations, like Gatwick, Leatherhead and Esher, also record the flow in m³/s or cumecs. This is a measure of discharge which is the volume of water passing a point every second, in metres cubed per second.

Here is an example of output from the Flood Assist website which has interactive charts extending back to 2021. Sometimes, as in this example from a peak discharge event on 18 November 2022, the maximum height of the river in metres asd arrives earlier (or later) than the peak discharge measured in cumecs. The river level can also fluctuate more wildly than the discharge. I am not entirely certain why this happens, so ideas very welcome in the comments!
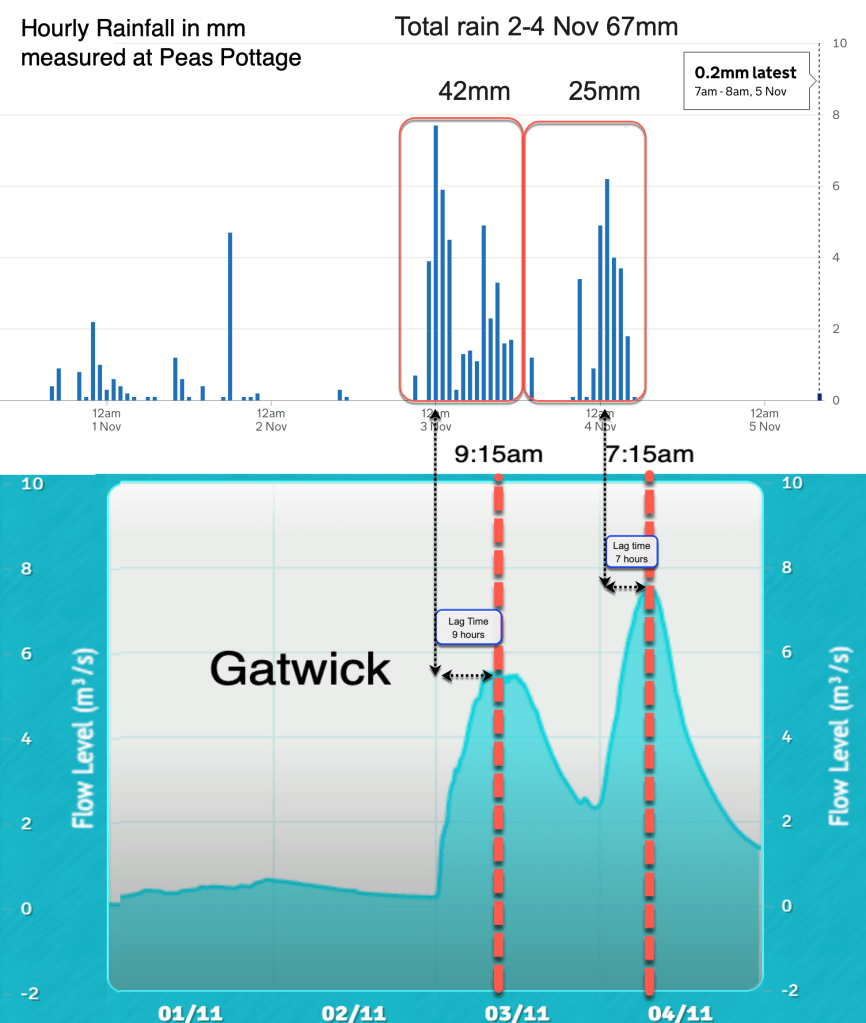
At just 9km from the source of the Mole, the gauge at Gatwick Airport responds very quickly after rain. One example from early November 2022 shows two significant rainfall events in close succession. They caused a predictable double peak in river level but the response shows how lag times reveal interesting things about how river flow behaves. After an historic dry summer the early November rain fell on fairly dry ground so the initial response to the 42mm of heavy, thundery rain on 3 November was rapid, running off baked ground. The 25mm of rain following hard on it’s heals on 4 November caused the river to peak at a higher discharge, yet with a lower rain total, probably because it was starting from a higher “base flow” and the ground was more saturated by preceding rainfall so river levels rose even higher.
Let’s look at another storm. The 16 November 2022 experienced a great deal of heavy rain with a total in some places in the Mole catchment exceeding 50mm in 24 hours which was a daily monthly record for some weather stations. The radar screen grabs below show the passage of the rain and the time of most intense rainfall.


A wide range of sources are used to identify the time of peak rainfall most representative of the catchment as a whole. My own weather station is often a start and then official rain gauges at Peas Pottage and Burstow (quite central to the Upper Mole basin) are compared to other AWS on Wunderground and other sites. Cross checking with rainfall radar provides further confidence to select a representative basin wide maximum for rainfall intensity.

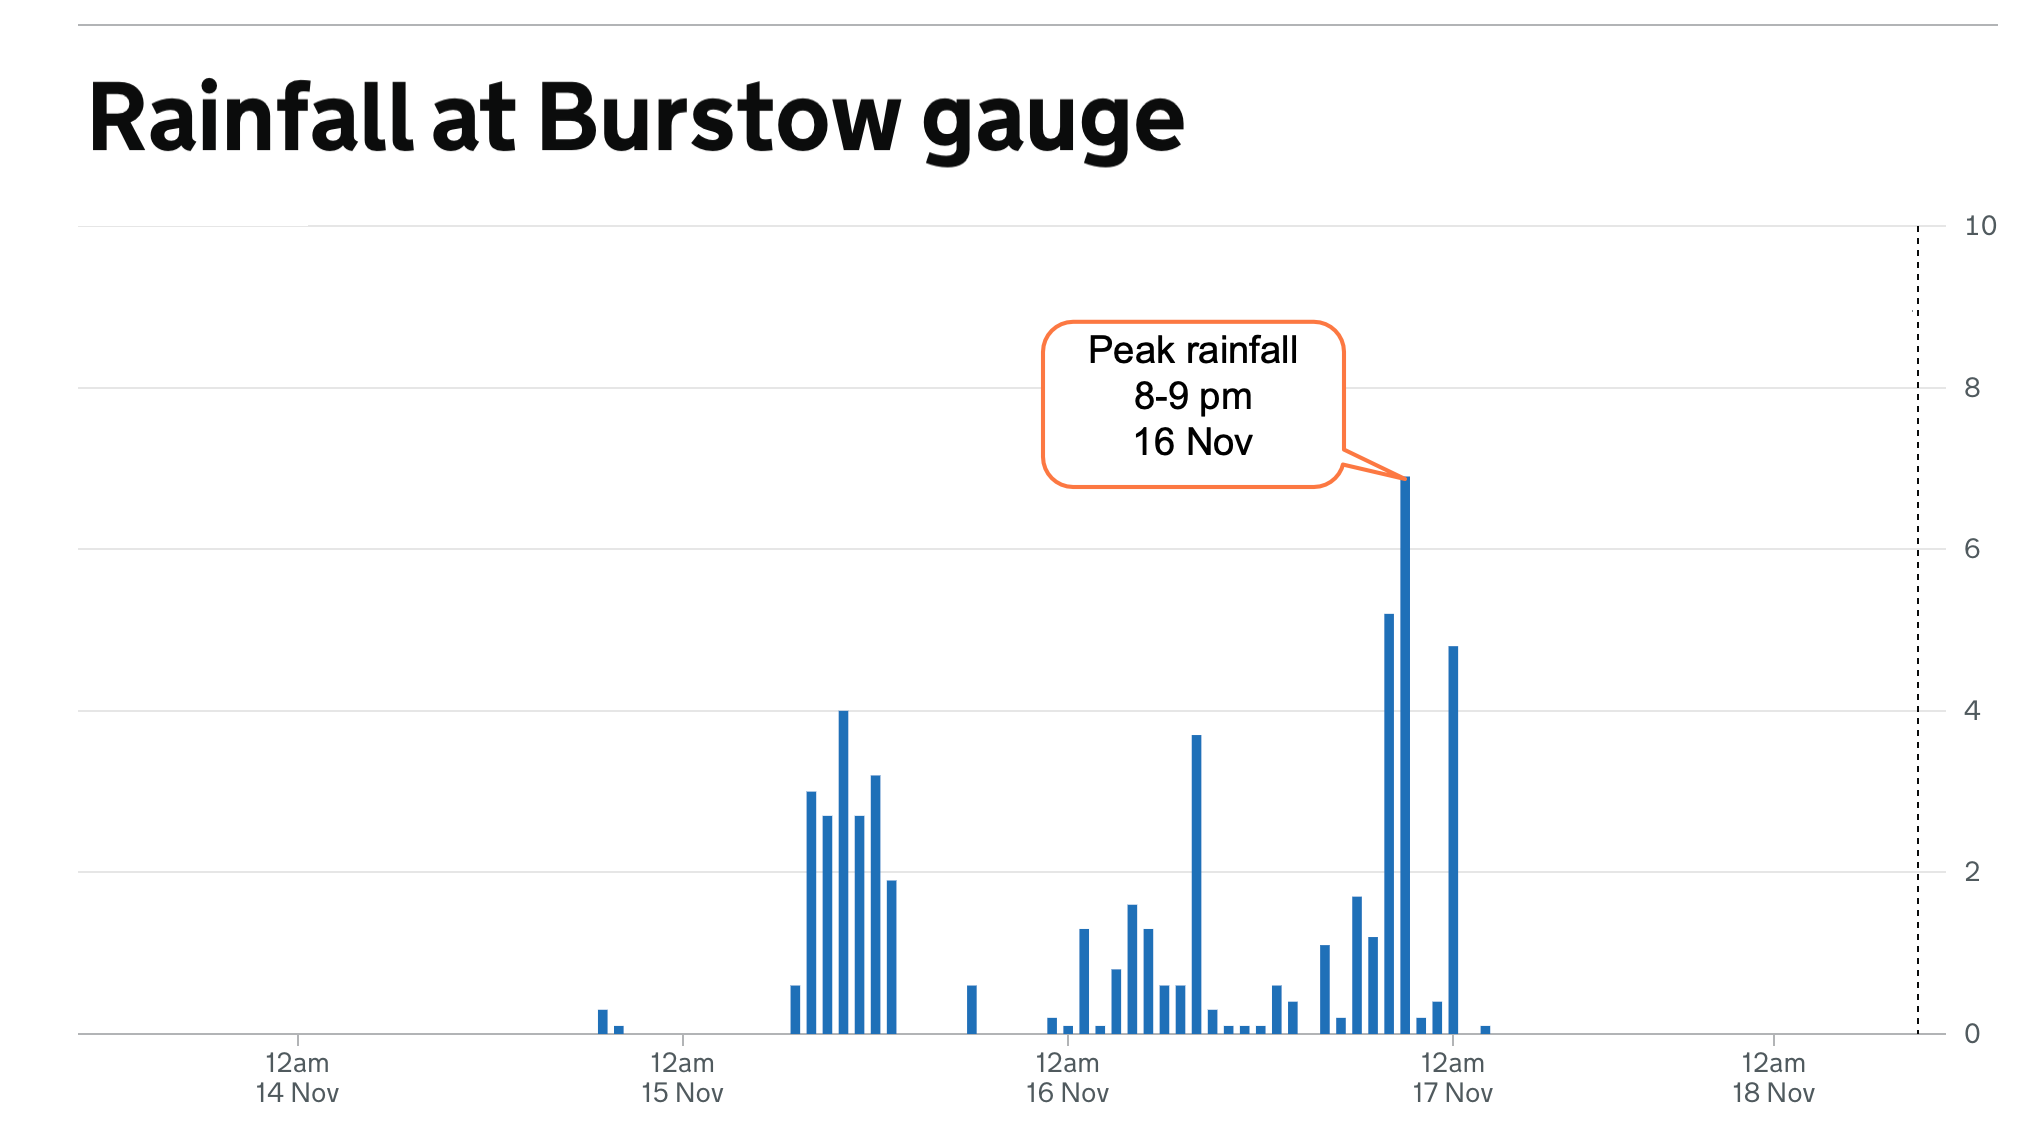

The chart below shows that peak rainfall occurred at 20-21:00hrs on 16 November. Now imagine the peak discharge from this event travelling downstream to each gauging station. How long did this “surge” take to reach each location?
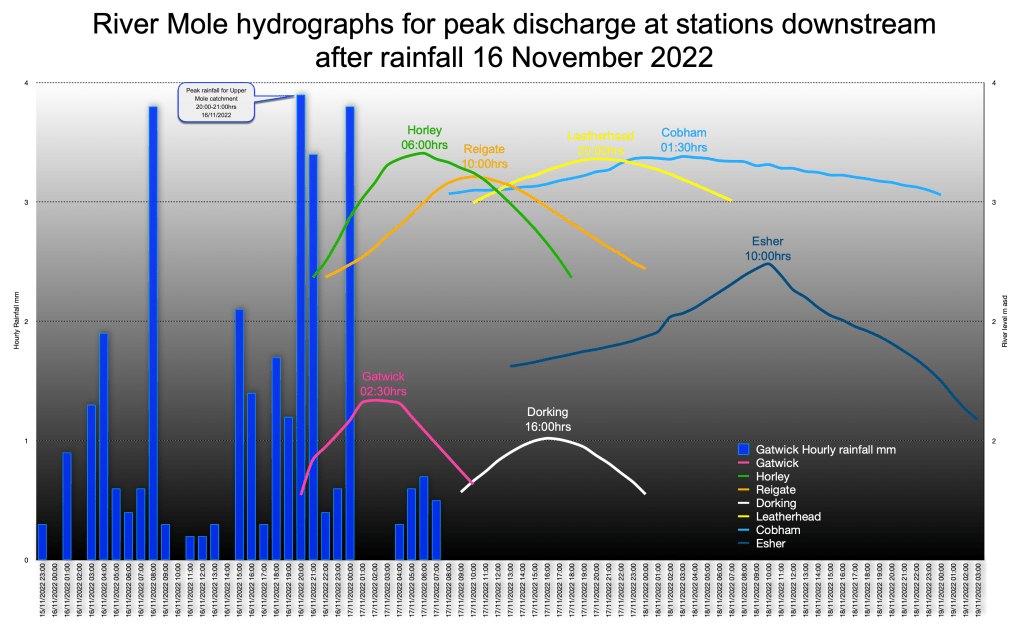
The chart above shows the rainfall event and the time the peak discharge arrived at each station. Note the river level varies downstream because m asd (metres above stage datum) measures the depth of the river at each gauge location. The depth will vary according to the cross section, so despite being further downstream and carrying a higher discharge, the level at Esher might be lower in m asd than Horley. The rapid rises are particularly noticeable in the Upper Mole where the basin is largest and rock type and land cover most conducive to rapid runoff. Lag times vary a lot between rainfall events and considering why they vary is interesting.
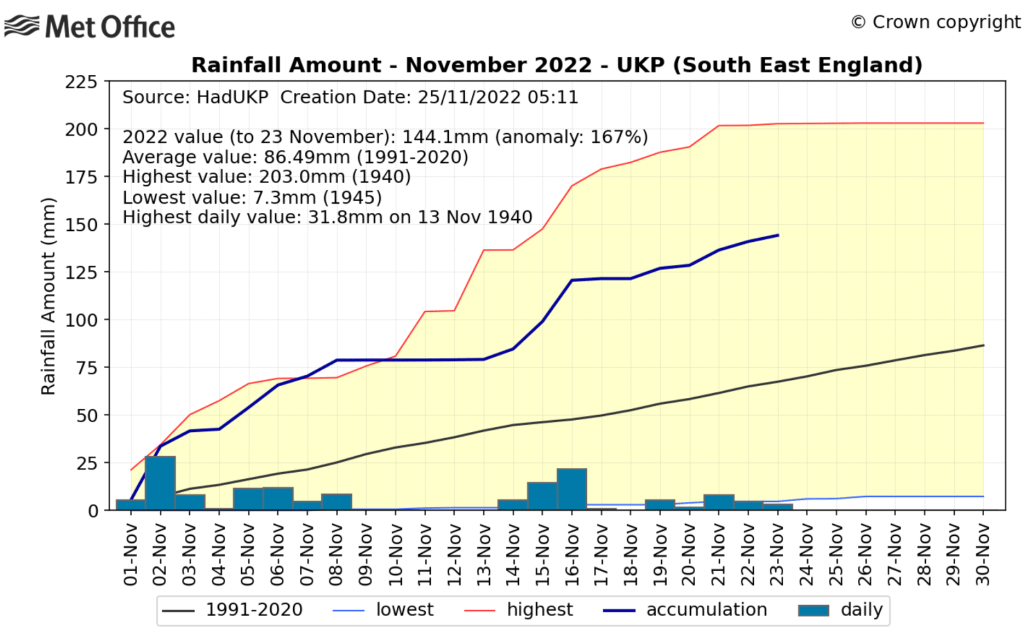
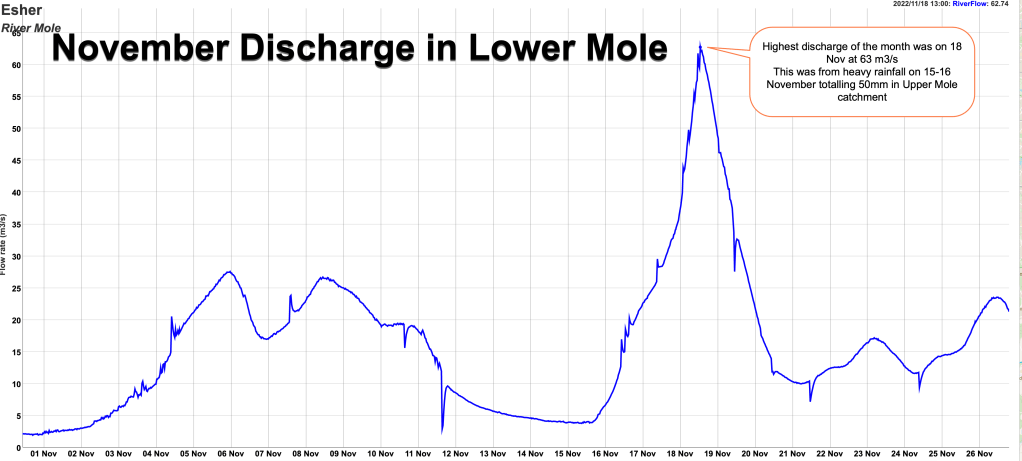
November 2022 has had several distinct rainfall events with accumulation approaching double the monthly long term average for Surrey shown in the chart below.
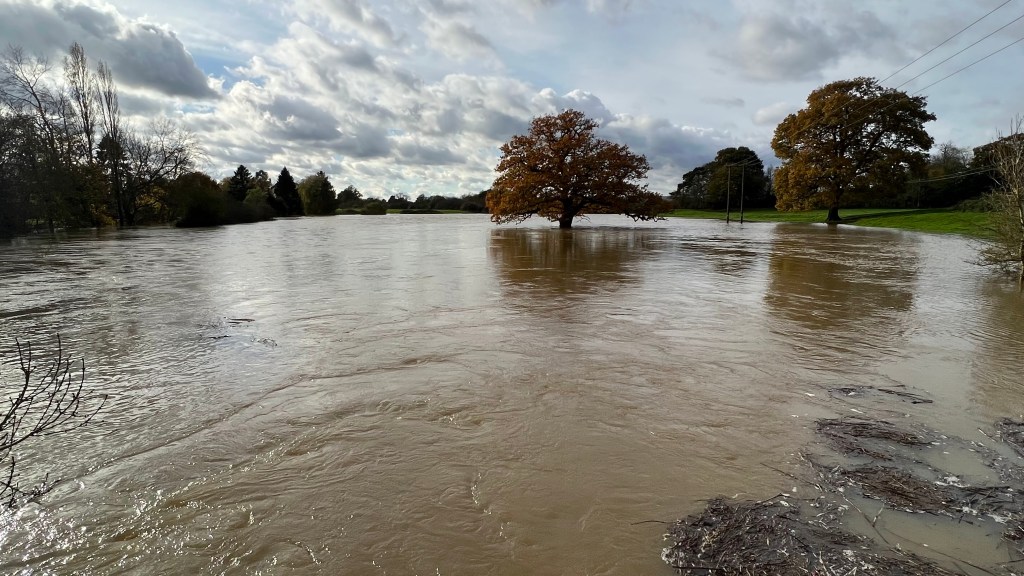
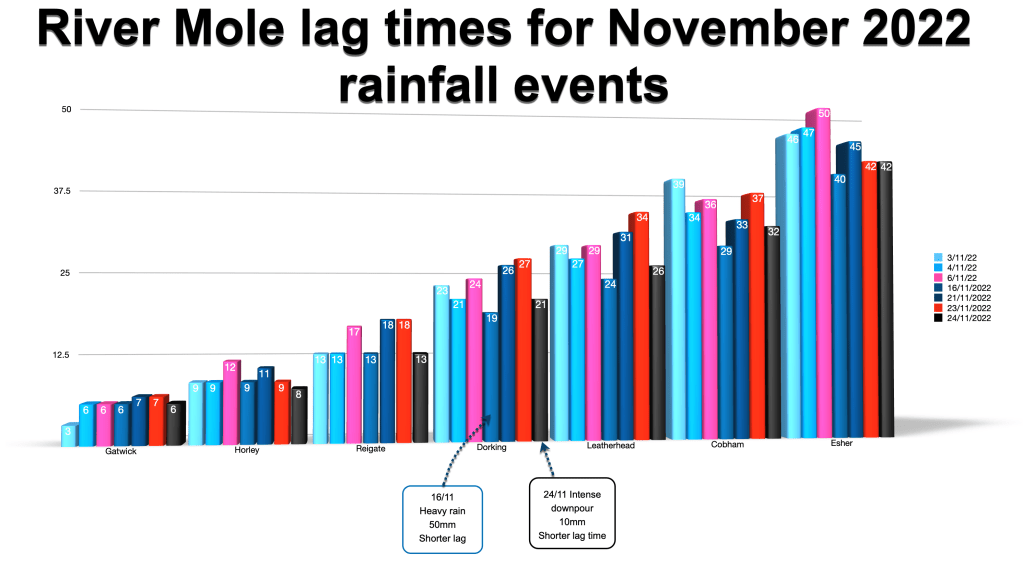
The bar chart shows lag times for seven November rain events from 3 November to 24 November. Early in the month the Lower Mole lag times appear to reduce somewhat (i.e. faster more responsive rises) perhaps as the ground saturated and surface runoff increased over infiltration. The biggest rainfall event occurred on 16 November and this has the shortest lag time particularly in the Lower Mole. Photos below show flooding on 17 November in the Upper Mole around Reigate and Horley.


The 16 November event was associated with prolonged heavy rain from 15-16 November totalling over 50mm in some locations in the catchment, so this was a large rain event with a flow at Esher way above any other in the month with a max discharge of 63 m3/s at 13:00 hours on 18 November, over 40 hours after peak rainfall.
Heavy intense rain tends to cause more rapid response as all the rain gets to the river “a once”. Larger discharges might also flow more efficiently in channels towards the lower reaches in Cobham and Esher, possibly contributing to shorter lag times there.
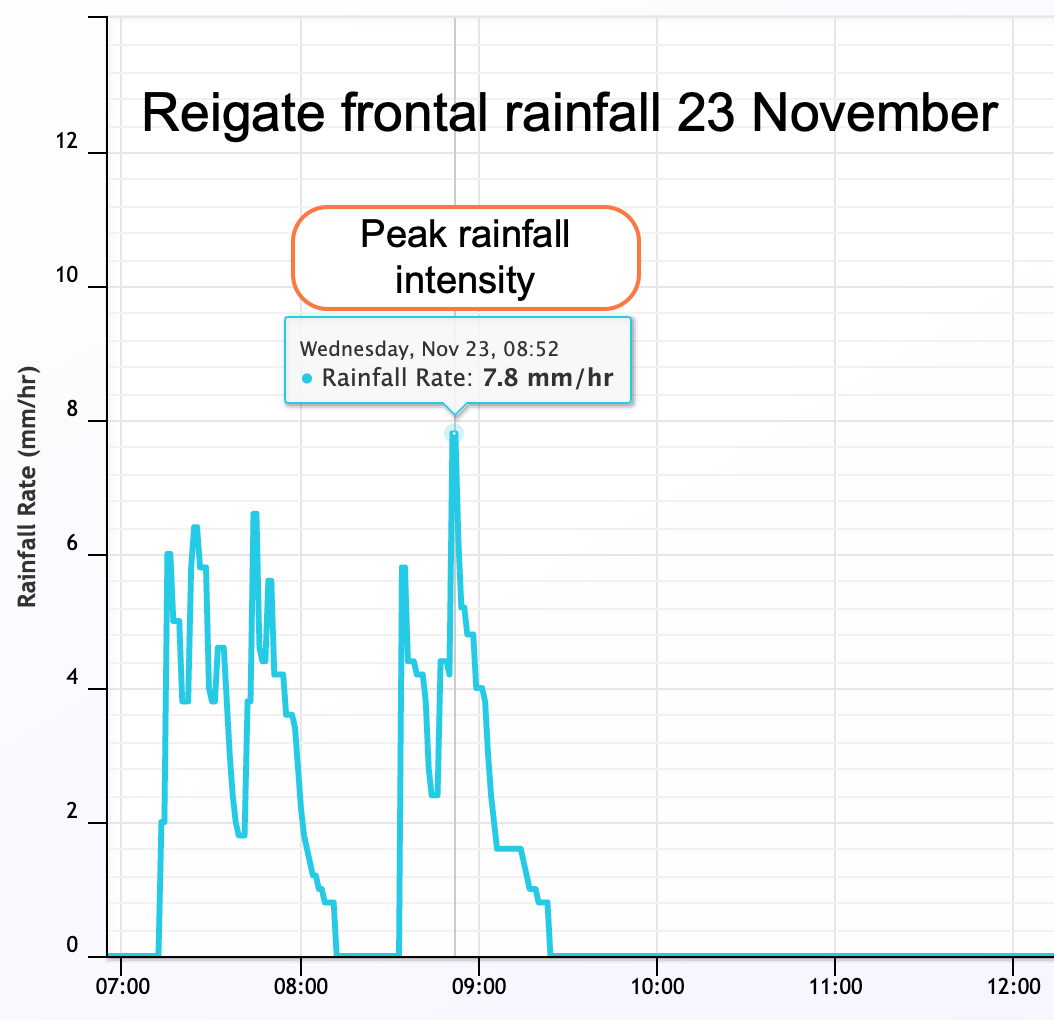
Later rain events on 21 and 23 November show a return to a slower response nearer the average. This is likely due to rainfall for both events being lighter with more modest totals, at less than 10mm over 5 hours on both occasions. Lighter rain causes a more stately response in the river.
I am updating a running mean of lag times which are settling on the average response times below.
This quick tour looking at how the River Mole responds to recent rainfall shows that each rainfall event is unique, producing different responses in the river depending on rainfall intensity, rainfall total and duration as well as preceding conditions in the basin (i.e. ground saturation).
Other factors are important including where and when the rain falls most heavily over the catchment. For example, on 16 November a final heavy shower at 23:55 hours over the east of the catchment caused Burstow Brook to have the highest discharge recorded at the Peeks Brook Lane gauging station. This caused flooding and the closure of the M23 the following morning! Lag times are important!
I hope you enjoyed this post which tried to shed light on how quickly the River Mole responds to rainfall and suggest some reasons. Please LIKE and subscribe to my post and do leave a comment. Thank you for reading!


Leave a reply to Lorraine KORDECKI Cancel reply