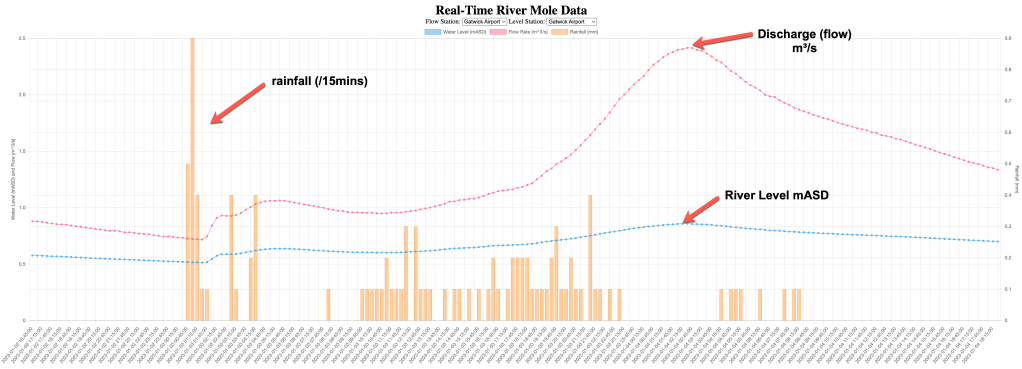
Here is a link to my webpage showing rainfall in the Mole catchment and river levels for gauges downstream. For three of the gauges, Gatwick, Leatherhead and Esher, there is also flow measured as discharge in cumecs.
There are other pages that show river levels but, to my knowledge, this is the only one showing catchment rainfall and river flow together. This means lag time and river response can be seen more clearly. Full credit goes to my son Ed for doing the coding!
Please refresh the page to fit the screen after or after making any selections.
I am interested in how the river responds to rainfall. This is known as lag time which is defined as the time between peak rainfall and peak discharge. Short lag times tend to mean more flooding as the rainfall arrives at the river “all at once”. Typically, catchments with short lag times are characterised by being small and having steep slopes, impermeable geology and a large cover of urbanised land. The River Mole has short lag times compared to other rivers in the region because of a combination of all of these factors and is known for its flashy nature, rising and falling quickly.
The rainfall data supplied for this chart is from the official EA gauge at Burstow. It is reasonably central in the Upper Mole catchment area and so seems acceptable to represent rainfall.
The Upper Mole catchment is the largest rain-collecting area for the whole Mole so delivers most of the discharge downstream. At Dorking the mean flow is 3.8m3/s which represents some 70% of total mean flow downstream at Esher which has a mean discharge of 5.6m3/s.
I run a Vantage Vue weather station in my garden with the anemometer on the roof so if you need Reigate Weather Data please visit this page:
