Bit of a cryptic title but this follows my previous post on how our flashy local river responds to rain. Two recent contrasting rainfall events occurred at the tail end of this wet November and it struck me how the Mole responded quite differently to these. So in this post I have drawn up hydrographs and made some observations about the river’s response. I’d be delighted if you read it and, if you enjoy it, then like it and you are also welcome to leave a comment about anything to do with the Mole, I’d be interested in your thoughts. Thank you so much, Simon

It has turned out to be the wettest November in the South East on record with local weather stations recording over 200mm in Reigate which is over double the long term November average of 97mmm. Rainfall was even higher to the south and Plumpton, in Sussex, recorded a huge 400mm! Rivers have been running high and the Mole has been out of banks regularly through the month.
The contrasting storms on 24 November and 27 November are worth a look as they occur one after the other and seem to have very different impacts on the river.

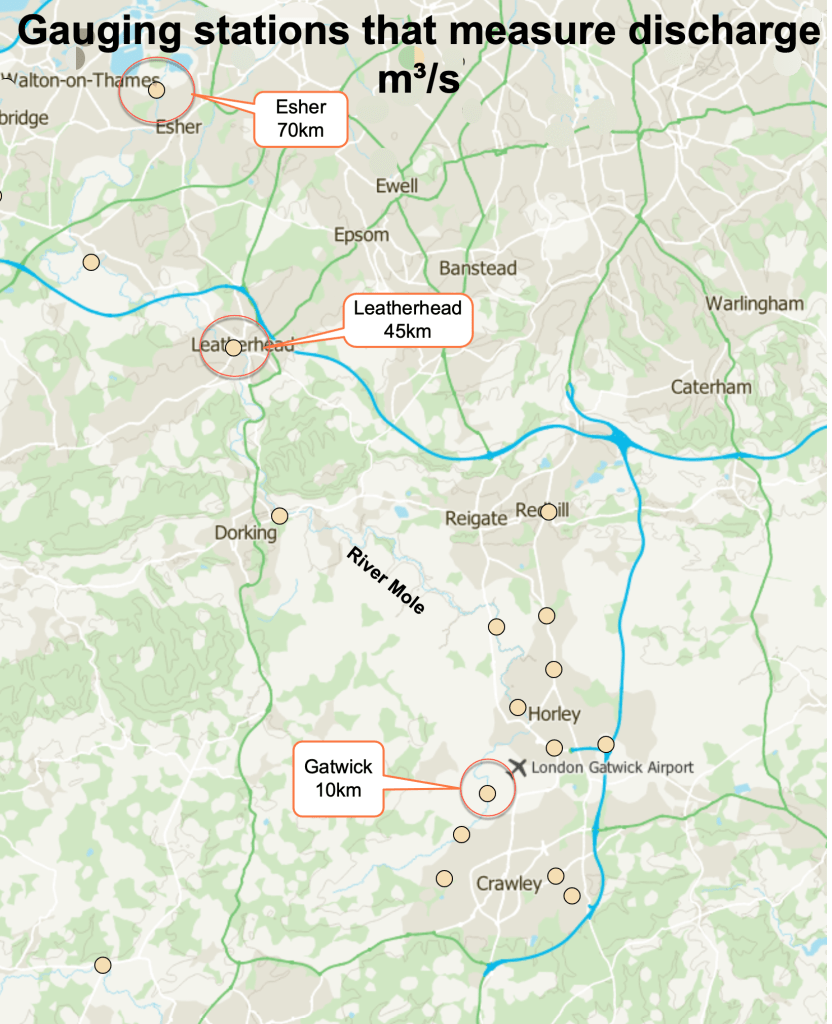
They are by no means record breaking rainfall events, but the nature of these two ordinary rainfall events differed markedly and affected river flow in surprising ways. The hydrographs for these events follow the peak discharge downstream through Gatwick to Leatherhead and then Esher. Each of these locations has a river gauging station that records flow in metres cubed per second (cumecs or m³/s) and so are directly comparable, rather than the more commonly available river level measured in metres above stage datum (m asd) which is affected by local river bed conditions. As an aside, we are extremely lucky that the Mole has such good coverage of river gauging stations compared to neighbouring rivers… they all return pretty reliable data, though peak flows at some do cause a few problems now and then with flood water flowing out of banks away from the flume.
The heavy rainfall on 24 November was associated with an active cold front that brought an intense downpour. It dropped 11mm of rain in less than 1 hour. There was even a clap of thunder over Reigate.

The rainfall on 27 November was altogether less exciting, spanning over 24 hours of light-moderate rain, but producing a higher total of 15mm. Both rain events are suitable to compare because they covered the entire catchment and were over two days apart so discharge from the first rainfall had “flushed out” of the system with a return to something near base flow.
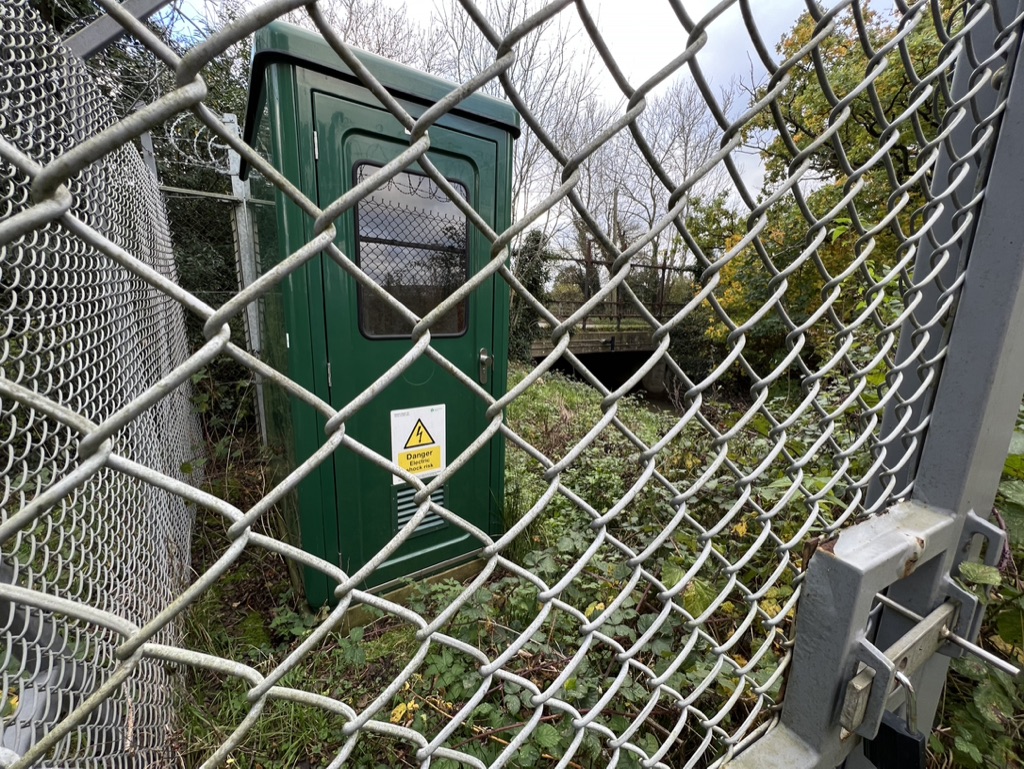
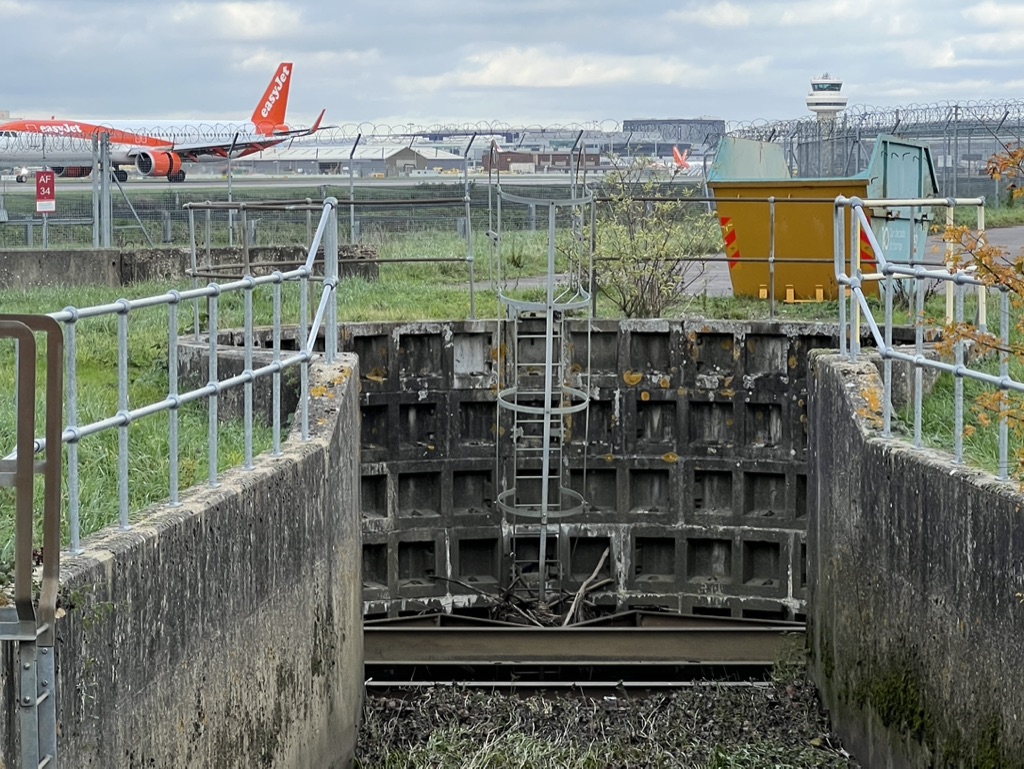
Gatwick airport gauging station shown above is located just before the river drops into the culvert under the runway. From the chart below you can see the river began to respond almost immediately to the intense rainfall. Gatwick is located 10km downstream from the source at Rusper and peak discharge was reached within 6 hours (average for this location despite intense rain) collecting water across a small drainage basin with source streams from Buchan Park, Rusper, Bewbush and Crawley.

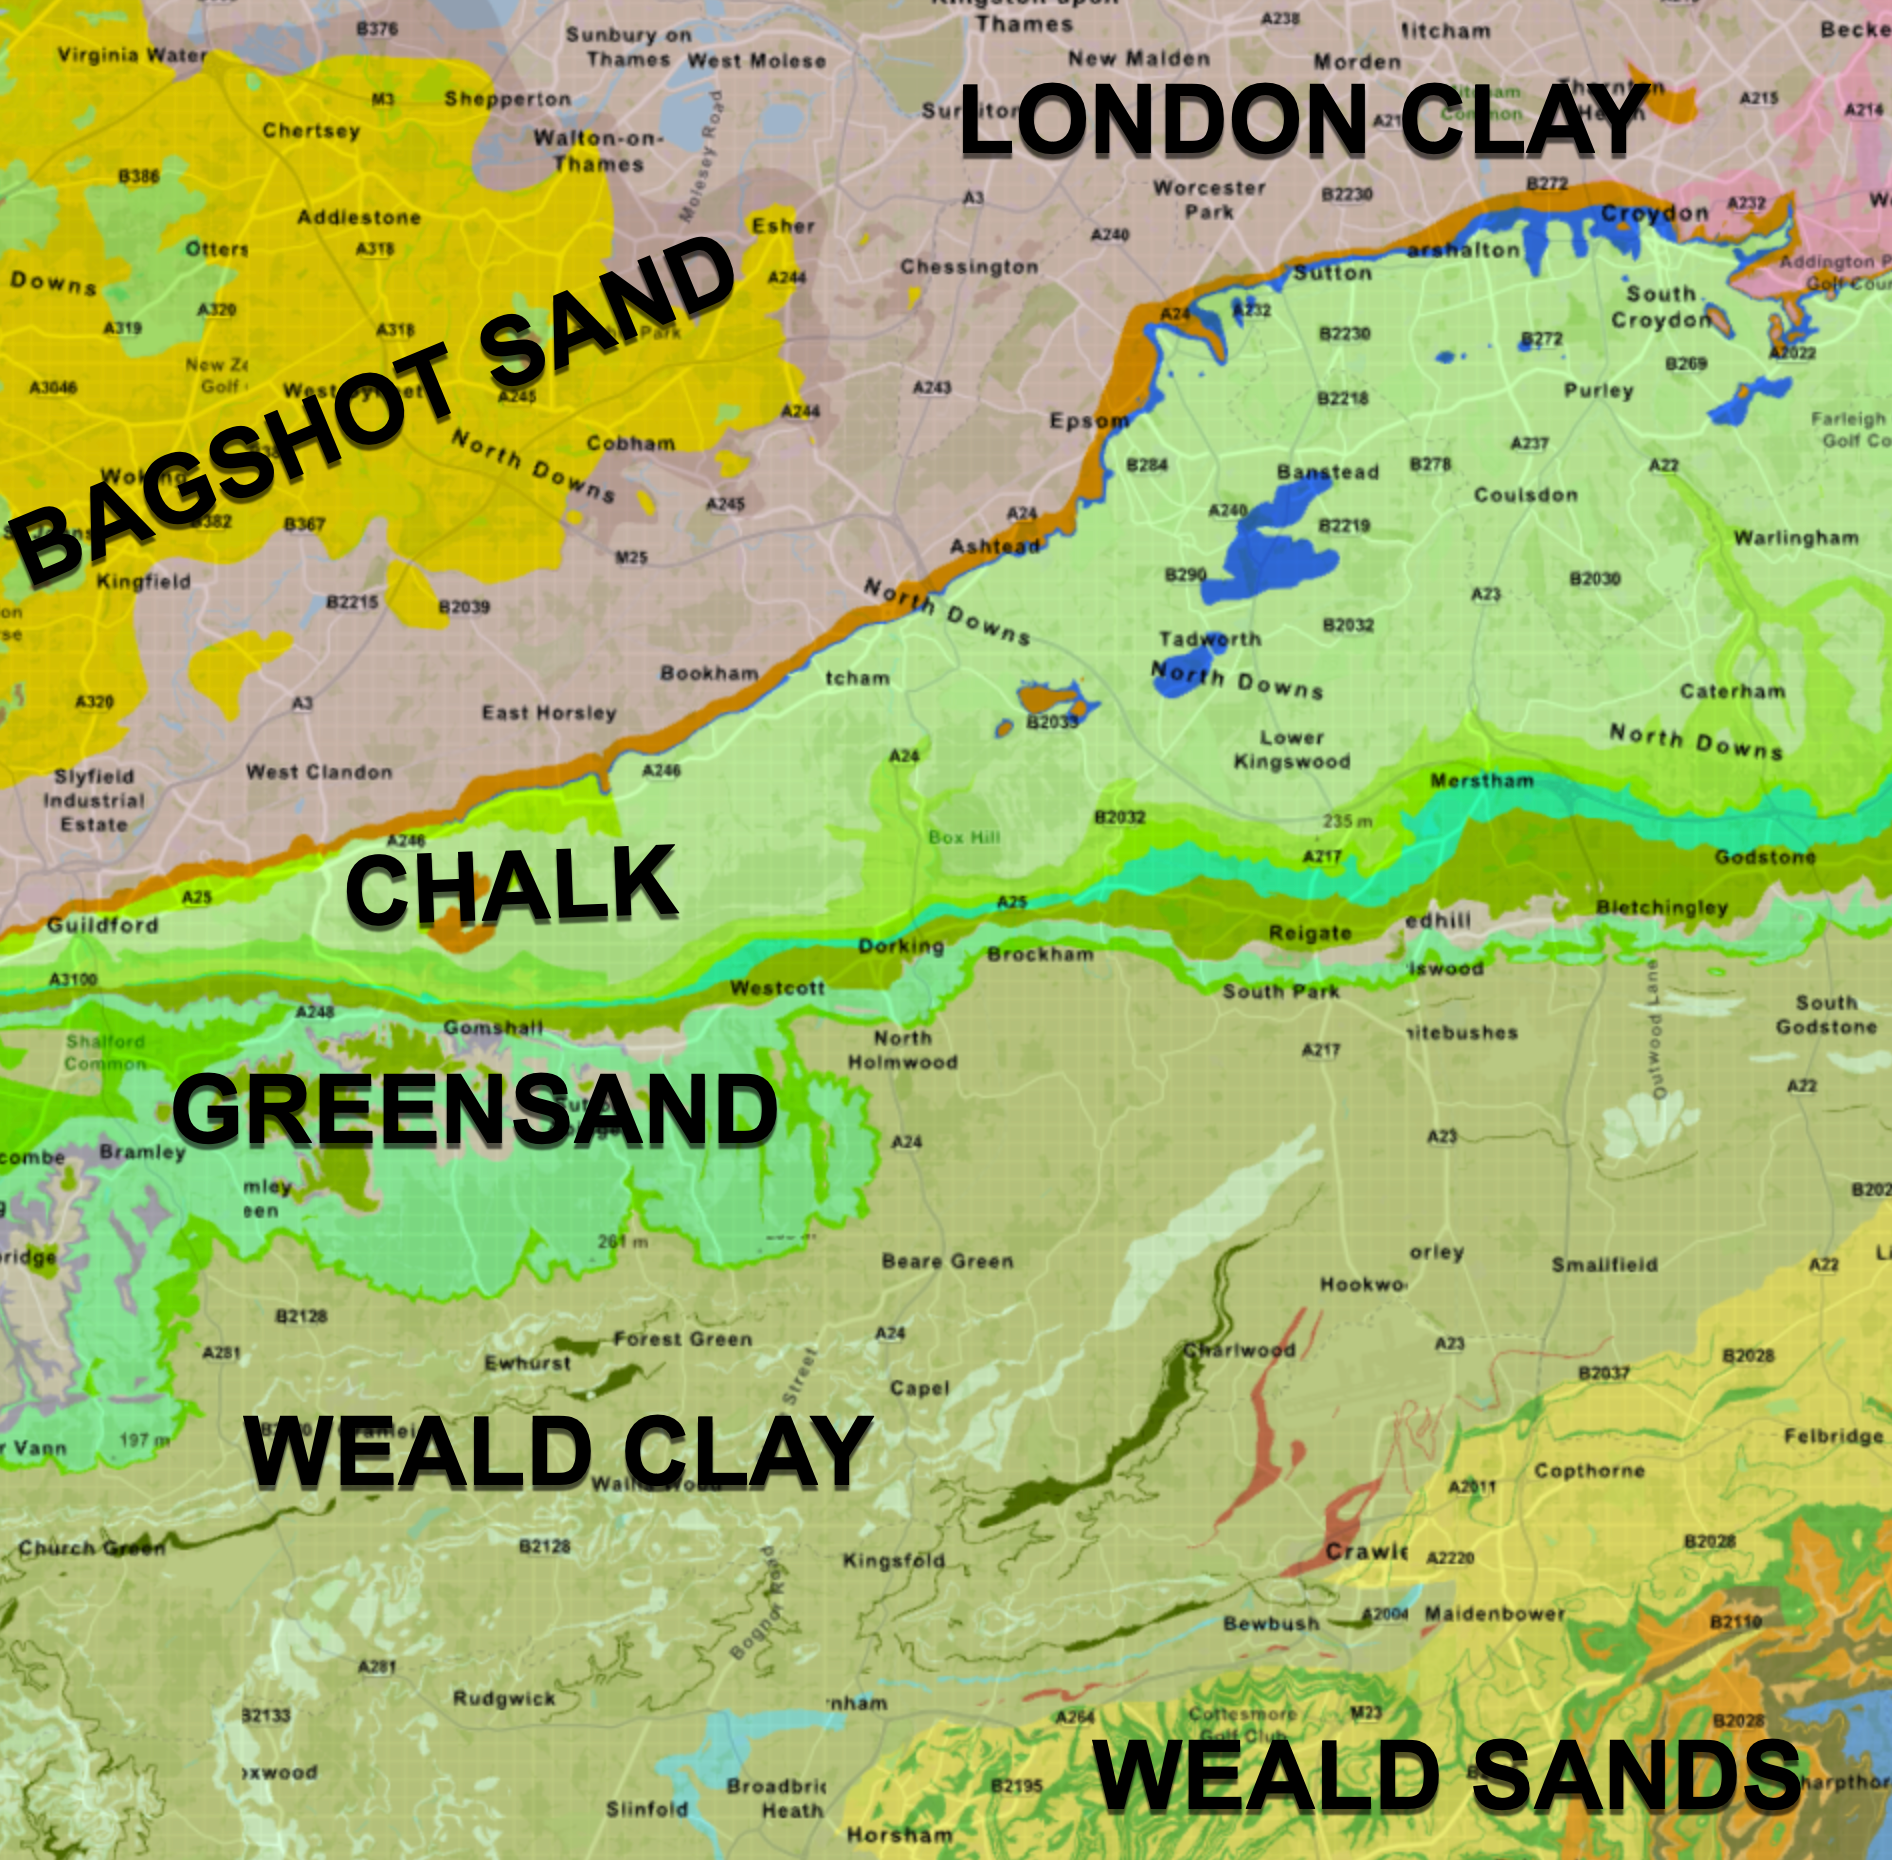
The short lag time at Gatwick is due to the relatively steep 86m descent in the first 10km from over 140m at the various sources to 59m at the gauge. Geology is another critical factor promoting flashiness with over 88% of this part of the Upper Mole basin classified as “very low permeability rock”, mostly Wealden Clay.

For the second, more gentle and longer, rainfall event on 27 November, the lag time at Gatwick was, somewhat surprisingly, still 6 hours. Textbooks suggest lower rainfall intensity is one factor that usually produces longer lag times. However, peak rainfall occurred at 5:30am and the peak discharge of 5m³/s reached Gatwick by 11:30am so this is a similar lag time to the intense rainfall event. However, despite a higher rainfall total, the longer duration of the rainfall on 27 Nov produced a lower peak discharge than the intense storm on 24 Nov. Peak discharge on the 24 Nov was 6.65m³/s while on the 27 Nov peak discharge was only 5m³/s, nearly 2m³/s lower despite a higher rainfall total. From these two storms it seems, for the Upper Mole, the intensity of rainfall has more impact peak discharge than the lag time. For these two storms and in this basin, the more intense rainfall appeared to produced a higher discharge but not a shorter lag time.

Is it the same story as we follow the peak flow downstream? Do these two different storms, one intense heavy rain with 11mm falling in 45 minutes, the other light rain with 15mm falling over 24 hours, have any impact on the nature of discharge and lag times downstream?
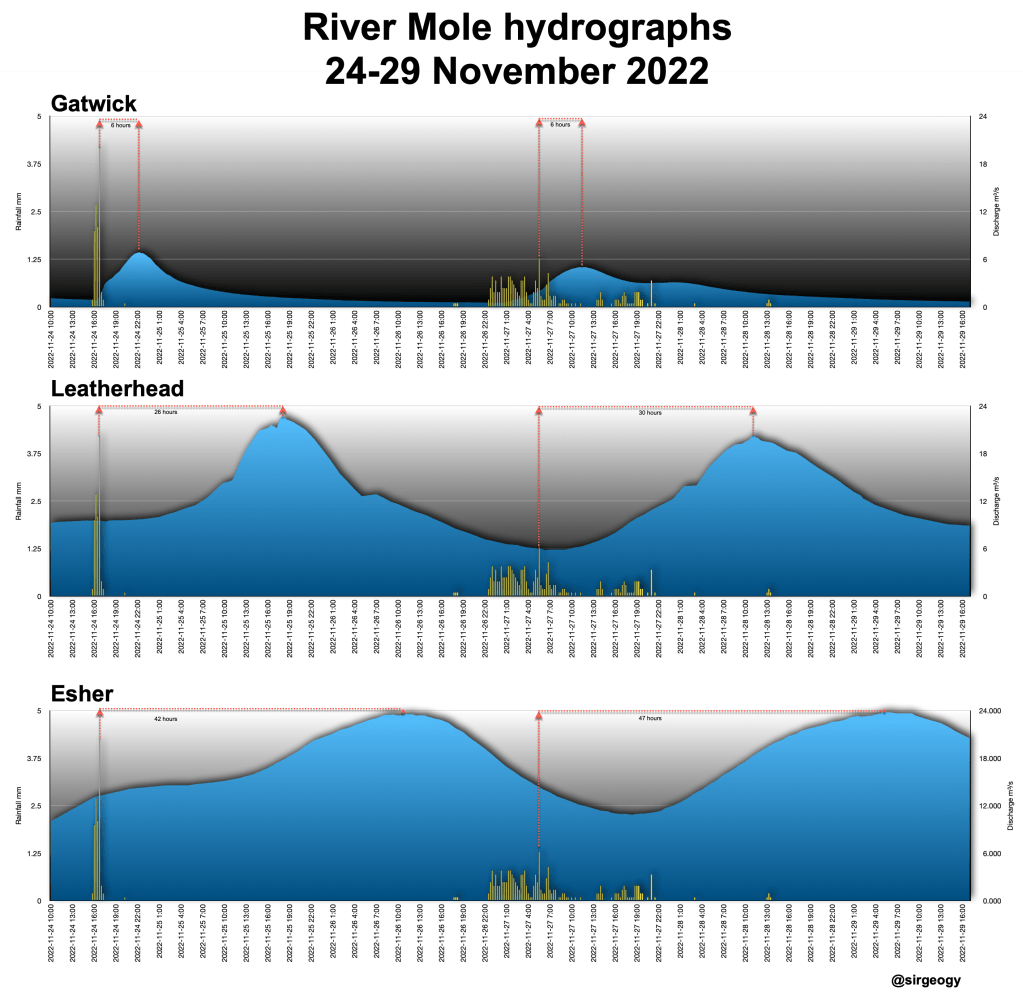
The chart above shows the discharge curve (hydrograph) at the three gauging stations downstream. Unlike at Gatwick, the contrasting nature of the two storms appears to have had a big impact on lag times further downstream. The more intense storm on the 24 November caused markedly short lag times at both Leatherhead and Esher. At 26 and 42 hours respectively, these are both two hours less than the average lag times at these stations calculated for November 2022 as a whole.
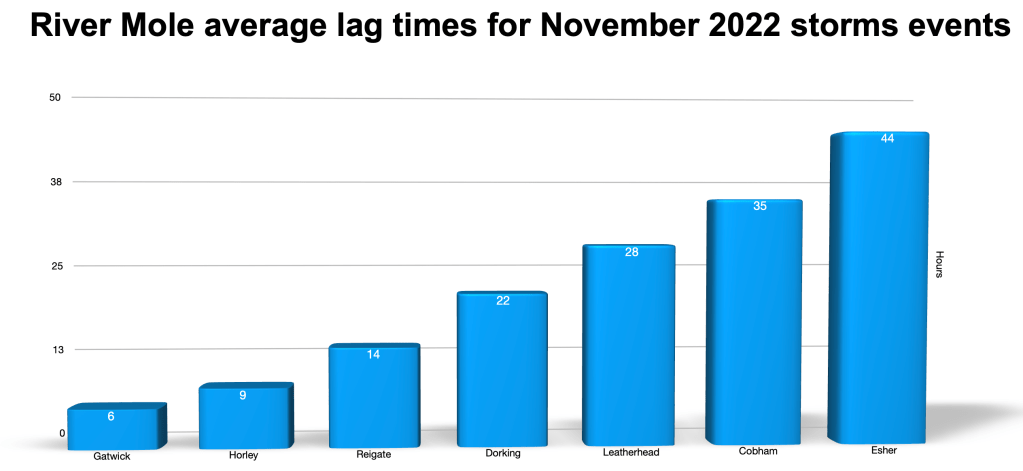
The longer lighter storm on 27 November produced longer lag times, a slower response, at both Leatherhead and Esher. At Leatherhead the lag time was 4 hours longer than the intense 24 Nov storm and 2 hours over the average; while at Esher the lag time was 5 hours longer than the intense 24 Nov storm and 3 hours over the average. Altogether the slower lag times for the gentler rain event were more textbook! It’s perhaps surprising that the affect of these storms on lag time seemed to increase downstream, having less impact at Gatwick than 70km downstream at Esher.

The impact on discharge is a different story: at Gatwick the intense 24 Nov storm produced a discharge over 1.5m³/s larger than the 27 Nov rain and this difference increased to over 2m³/s difference at Leatherhead. By Esher however, the discharge was pretty much the same, if not slightly higher in the second storm. It’s worth remembering that this catchment has sewage effluent discharges that I suppose, unfortunately, can “top up” peak flows. There is no live data available for sewage spills, yet! The EA and others are demanding live data which cannot come soon enough IMO.
So, in summary, rainfall intensity seemed to control peak discharge in the upper course but had less influence on lag time. Gatwick rose to a higher peak discharge in the intense storm despite lower rainfall. In the lower course, lag time from intense rainfall seems to be reduced markedly with the surge of peak discharge appearing to move more efficiently downstream than in less intense rainfall events. However, the impact on discharge seems to get less pronounced downstream. The less intense 27 Nov storm raised levels eventually higher at Esher than the 24 Nov deluge.
There are clearly lots of factors that affect discharge and lag times. These are my observations from analysing these two different storms.
Thank you for reading. If you enjoyed this post please like it! Any suggestions or edits please let me know. Thank you so much. Simon.

Leave a comment