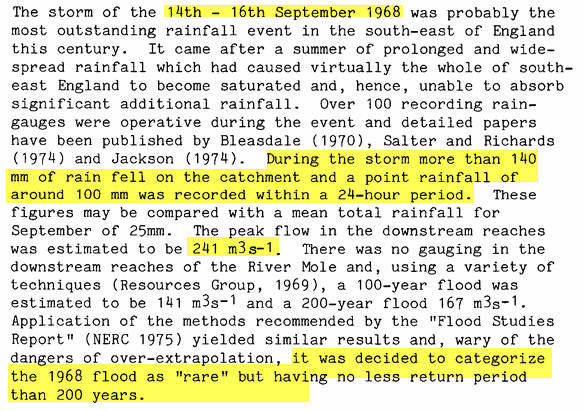
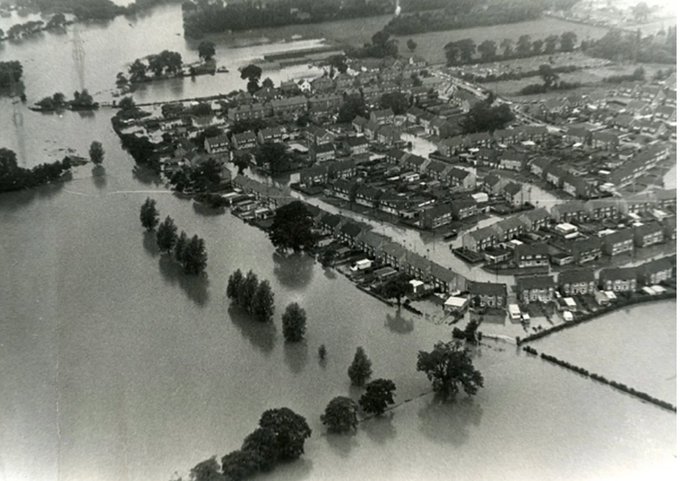
The worst recorded flooding in the River Mole was in 1968 when a rare 1:200 year storm caused rainfall to exceed 100mm in 24 hours and a staggering discharge over 240 cumecs in the Lower Mole (see extract below). For comparison, the average discharge of the River Thames in London is 65 cumecs and the average September rainfall is 25mm.
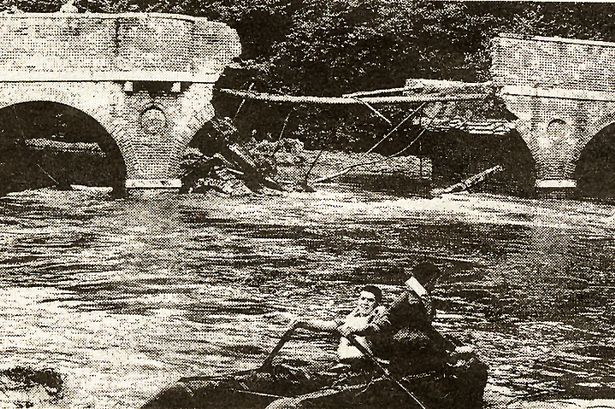
This event became the heaviest short rainfall event in SE England and caused an enormous discharge on the Mole that flooded thousands of homes from Leatherhead north into Cobham, Hersham, Esher, Chertsey and Molesey.
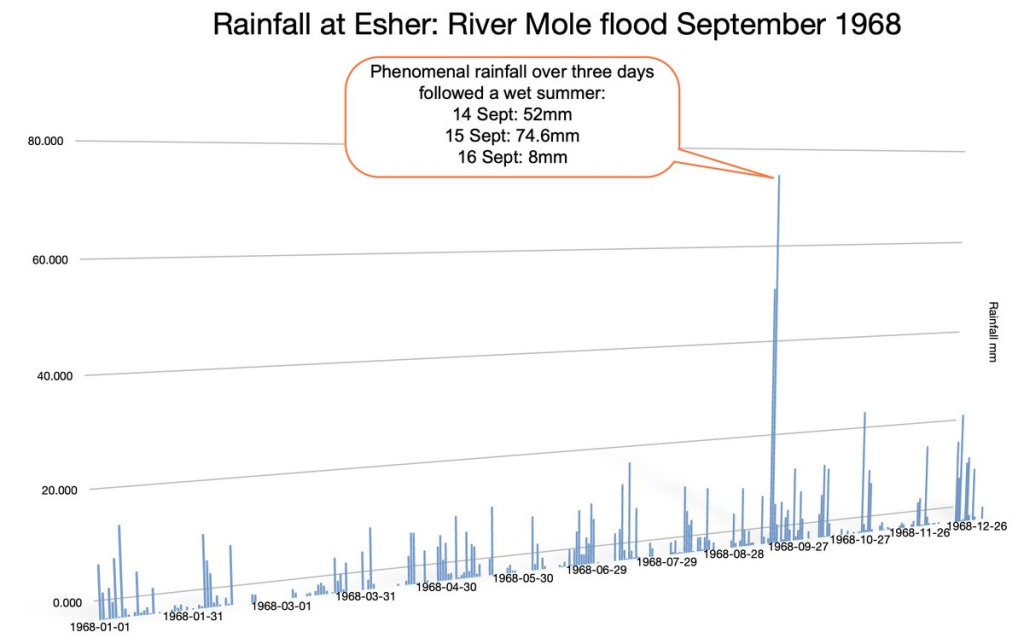
For three days in September 1968 the rain was relentless in Surrey and the biggest deluge was over the River Mole catchment. On 14 Sept >50mm fell, then >75mm fell on 15 Sept and around 8mm on 16 Sept. A trough disruption in the Atlantic set the weather scene for this event.
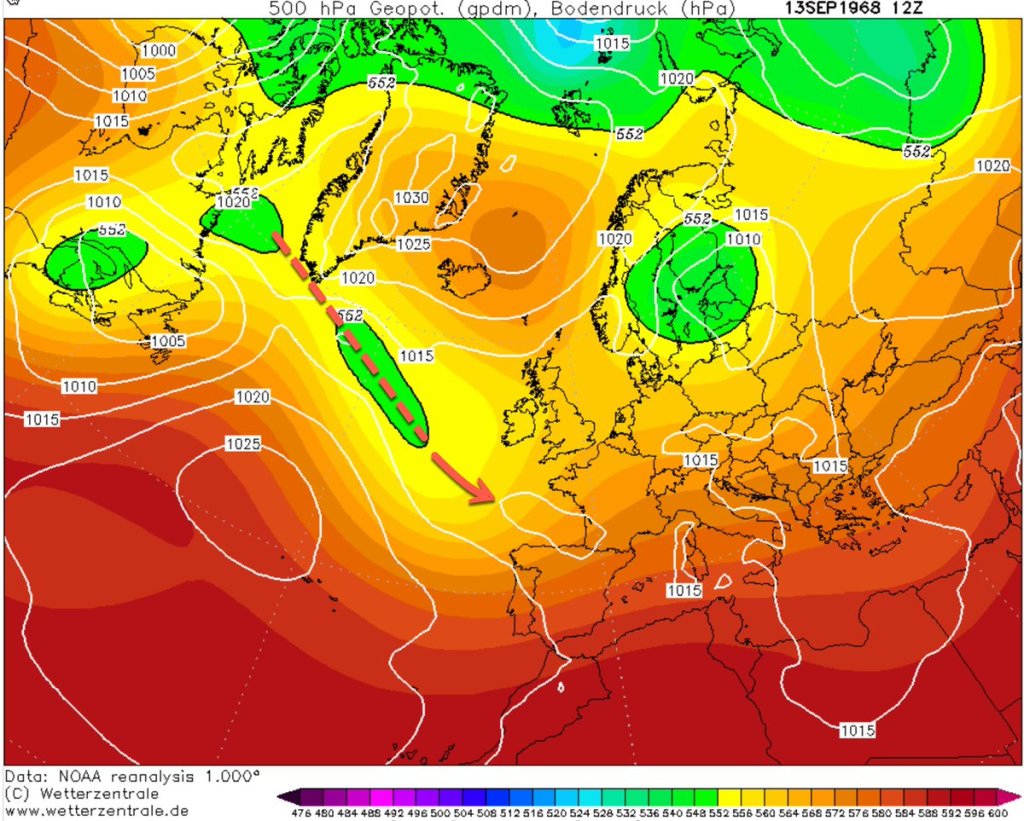
On Friday 13 Sept 1968 an innocuous flabby low formed over the Bay of Biscay. This intensified over the next few days but didn’t move… it sat and funnelled moisture to the UK and formed stationary fronts that stalled over the SE for three days.

Humid tropical air, loaded with moisture, met cooler air drawn in on strong North-Easterly winds from the N Sea. A steep temperature gradient formed and a jet streak intensified rainfall further on Sunday 15 Sept, the single worst day of rain ever recorded in our area.


While Esher recorded 75mm of rain on the Sunday, some places in the Mole catchment in #Surrey recorded 100mm of rain! This was to overwhelm the River Mole and cause the worst flooding on record.

The flow station at #Gatwick was the first to record the rising peak flood rising on the River Mole. Here it has an average flow of 0.7m³/s and responds within 5hrs of rainfall. Recent reconstructed flow series modelled the discharge on 15 September 1968 at 17-20 m³/s!!

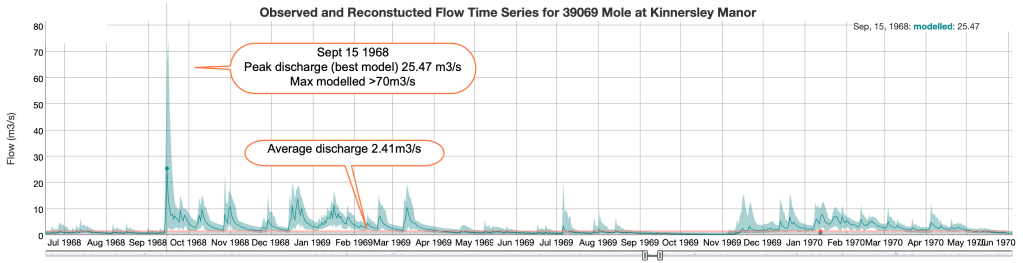
At #Reigate Kinnersley Manor the River Mole has an average discharge of 2.4m³/s. Reconstructions show the 1968 flood discharge may have peaked here at 70m³/s! This peak would have arrived some 8-12 hours after heaviest rain. Peak flows since 1968 have rarely reached 50m³/s
Unfortunately in 1968 there was no gauging station in the Lower Mole and there are no reconstructed flows for Esher but estimates put the peak flow of the Lower Mole at 241m³/s! This equates to a 1:200 year return period. The average flow of the River Mole at Esher is 6m³/s.

Floods on the River Mole since then haven’t approached the deluge of Sept 1968 but 25/12/2013 came closest with 147.6m³/s recorded at Esher. For comparison, the average flow of the Thames in London is 65m³/s.


The floods of 1968 were designated a 1:200 year return period. However climate change will bring intense rain more often so we should be prepared for our River Mole to be overwhelmed by extreme events again.


What’s changed since 1968 is increased building on the flood plain: residential, industrial and infrastructure. Not all are bad actors, some have flood and pollution controls, but there are examples of users increasing flood risk and pollution to themselves and downstream.
In my opinion, perhaps surprisingly, the single land user offering most protection for the Mole is #Gatwick which is constantly working to monitor and process runoff as well as installing state of the art flood protection and improving wildlife habitat.
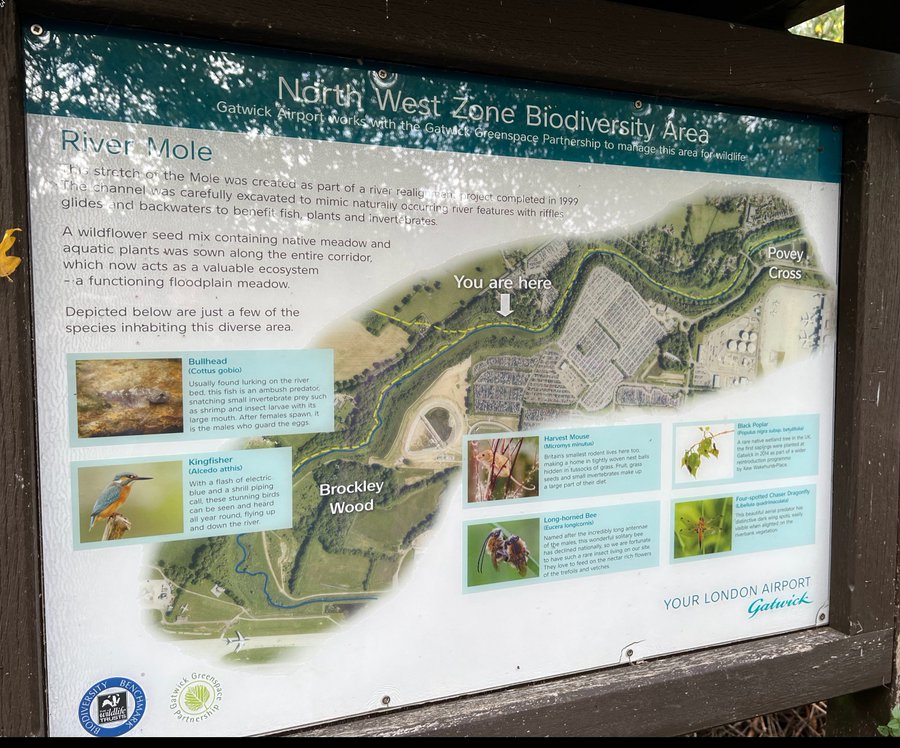
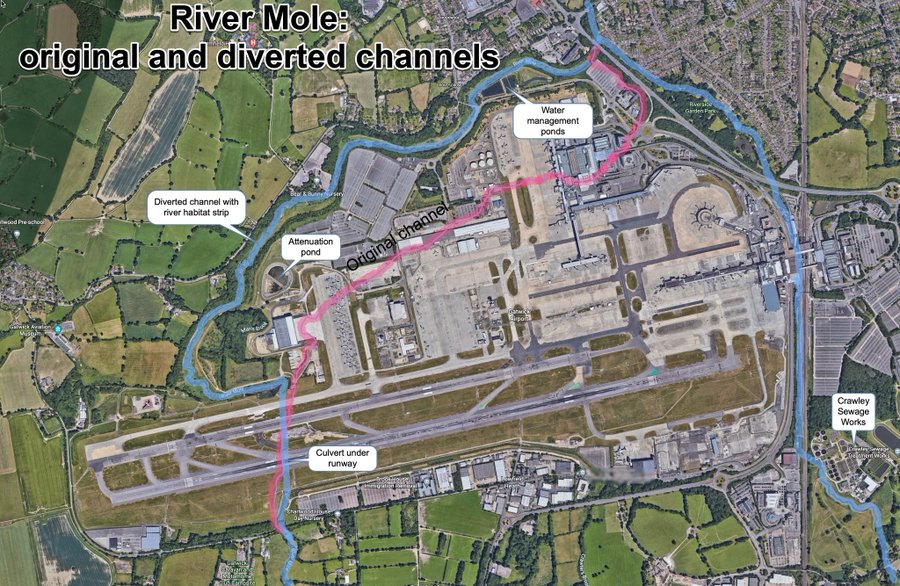
For example, the stretch of the River Mole running through Gatwick is one of the cleaner/less polluted parts. The Environment Agency ecological status for the Mole through Gatwick is “moderate” and “good” for fish. While many of the tributaries have a “bad” or “poor” status, possibly due to farm waste, or misconnected sewers or perhaps sewage outfalls. For example, the Burstow Stream has an ecological status of “bad” and “moderate” for fish and is one of the worst performing tributaries in the catchment regarding pollution status. I am not sure of the reasons for the bad state of Mole tributaries but we can assured that Gatwick airport is not one of the bad actors in the Mole drainage basin and, as outlined in my other posts, it invests in pollution controls, testing runoff and water treatment as well as doing what it can to enhance biodiversity. It is also carefully regulated and works closely with the Environment Agency and Thames Water.
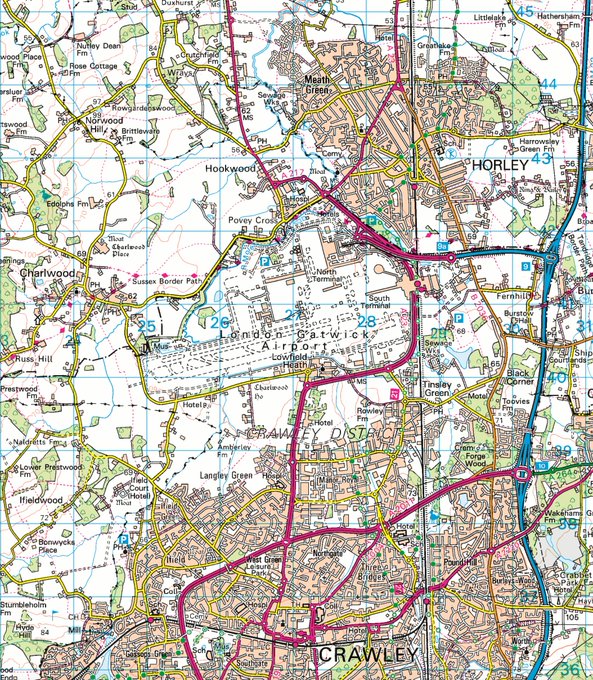
The map below shows 2021 data and is available here https://environment.data.gov.uk/catchment-planning/OperationalCatchment/3495


Leave a comment